Beskæftigelsesudvalget 2019-20
BEU Alm.del Bilag 243
Offentligt
Journal of Occupational and Environmental Medicine, Publish Ahead of Print
DOI: 10.1097/JOM.0000000000001879
Leadership quality and risk of long-term sickness absence among 53,157 employees of the
Danish workforce
Downloaded from https://journals.lww.com/joem by BhDMf5ePHKav1zEoum1tQfN4a+kJLhEZgbsIHo4XMi0hCywCX1AWnYQp/IlQrHD3bhnalqTQiPunQiZA71rqYF46izNURxwK9QwFTkKMhzX6YyBHuIt1BQ== on 04/27/2020
Jeppe Karl Sørensen, MSc (1), Elisabeth Framke, PhD (1), Thomas Clausen, PhD (1), Anne
Helene Garde, PhD (1,2), Nina Føns Johnsen, PhD (1), Jesper Kristiansen, PhD (1), Ida E.H.
Madsen, PhD (1), Mads Nordentoft, MSc (1), Reiner Rugulies, PhD (1,2,3)
(1) National Research Centre for the Working Environment, Copenhagen, Denmark; (2)
Department of Public Health, University of Copenhagen, Denmark; (3) Department of
Psychology, University of Copenhagen, Denmark
Corresponding Author:
Jeppe Karl Sørensen, MSc
National Research Centre for the Working Environment
Lersø Parkallé 105, DK-2100 Copenhagen, Denmark
Phone: +45 39 16 53 05; Fax: +45 39 16 52 01; e-mail: JKS@nfa.dk
Funding:
The Danish Working Environment Research Fund (grant number 10-2016-03). The
funding source had no further role in the study design; data collection, analysis and interpretation
of data; in the writing of the paper, or in the decision to submit the paper for publication.
Conflict of interest:
None declared.
This is an open access article distributed under the terms of the Creative Commons Attribution-Non
Commercial-No Derivatives License 4.0 (CCBY-NC-ND), where it is permissible to download and share
the work provided it is properly cited. The work cannot be changed in any way or used commercially
without permission from the journal.
BEU, Alm.del - 2019-20 - Bilag 243: Orientering om resultater fra en NFA-artikel om ledelseskvalitet og langtidssygefravær, fra beskæftigelsesministeren
ABSTRACT
Objective:
To examine whether low leadership quality predicts long-term sickness absence
(LTSA) in Denmark.
Methods:
Using Cox models, we estimated the association between exposure to low leadership
quality and onset of register based LTSA (≥6
weeks) during 12-months
follow-up among 53,157
employees without previous LTSA.
Results:
During 51,155 person-years, we identified 2,270 cases of LTSA. Low leadership
quality predicted LTSA with a dose-response pattern after adjustment for confounders. The
hazard ratio (HR) of LTSA in the lowest compared to the highest quartile of leadership quality
was 1.61 (95% CI: 1.43-1.82). Further, change from high to low leadership quality over time
predicted risk of LTSA (HR=1.42, 95% CI: 1.02-1.97) compared to persistent high leadership
quality.
Conclusions:
Exposure to low leadership quality is a risk factor of LTSA in the Danish
workforce.
Keywords:
Psychosocial work factors; Stress; Managerial quality; Absenteeism; Longitudinal
study; Occupational health
BEU, Alm.del - 2019-20 - Bilag 243: Orientering om resultater fra en NFA-artikel om ledelseskvalitet og langtidssygefravær, fra beskæftigelsesministeren
INTRODUCTION
Leadership quality also denoted managerial quality or supervisory quality, relates to specific
behaviors or actions of a leader toward their subordinates. This includes for example the leader‟s
ability to provide guidance, solve conflicts, or support employees in their professional
development.
1
High leadership quality may be a job resource with the potential of buffering
health-hazardous exposures at work. According to Schaufeli and Bakker (2004) job resources are
aspects of work that reduce job demands, are functional in achieving work goals, and/or
stimulate personal growth, learning and development.
2
Low leadership quality may also cause
adverse working conditions, for example negative behaviors at work such as workplace
bullying.
3
Further, in accordance with the “Stress-as-Offense-to-Self” theory by Semmer et al.,
low leadership quality may be considered as a stressor in itself, as lack of appreciation,
acknowledgement, and the breach of the social contract of what can be reasonably expected from
a leader may directly affect employees‟ well-being.
4
Long-term sickness absence (LTSA) may be considered an important indicator of both somatic
and mental ill-health as it is strongly associated with risk of both disability pension and
mortality.
5, 6
Although leadership quality is a major topic in work and organizational
psychology,
7
it is uncertain whether low leadership quality is associated with risk of LTSA. So
far, prospective cohort studies on the association between leadership quality and risk of LTSA
have shown inconsistent results, with studies both demonstrating associations, absence of
associations and associations only in subgroups.
8-13
In general, this literature is characterized by
studies that are either based on relatively small samples or samples limited to specific
occupational groups. Further, to our knowledge, no studies have yet investigated associations
between changes in leadership quality over time and risk of LTSA. Examining such associations
would be important for guiding future interventions.
In this article, we report results from a large prospective study linking survey data of more than
53,000 Danish employees from a wide range of job types and industries with register data on
LTSA, defined as six or more consecutive weeks of sickness absence. In order to examine the
potential effects of intervening on leadership quality among employees in Denmark we
investigated (i) if low leadership quality predicted risk of LTSA and (ii) if low leadership quality
predicted risk of LTSA differently among men and women, age groups, educational groups and
sector of employment (private or public). We further investigated in a subsample of more than
7,000 employees with repeated measurement on leadership quality, (iii) if a change from high to
low leadership quality predicted risk of LTSA compared to persistent high level of leadership
quality.
BEU, Alm.del - 2019-20 - Bilag 243: Orientering om resultater fra en NFA-artikel om ledelseskvalitet og langtidssygefravær, fra beskæftigelsesministeren
METHODS
Study design and population
We used data from the 2012, 2014 and 2016 waves of the Work Environment and Health in
Denmark study (WEHD), a biennial survey data on working conditions and health. The design of
WEHD is described in more detail elsewhere.
14
Briefly, WEHD consists of a stratified workplace
sample conducted in 2012 and 2016, a nationwide sample conducted in 2012, 2014 and 2016,
and a cohort that consists of all responders from the 2012 wave of the nationwide sample who
also received a questionnaire in 2014 and 2016. We included first-time respondents from the
stratified workplace sample and the nationwide sample (study population 1) and respondents
from the cohort responding in 2012 and 2014 (study population 2). Inclusion criteria for all
participants were being (i) liable to pay taxes in Denmark, (ii) aged 18-64 years, (iii) employed
with at least 35 hours monthly and with a monthly income of at least 3,000 DKK (460 US
Dollar, 400 Euro as of 31 December 2012), and (iv) not having a „research protected‟ address.
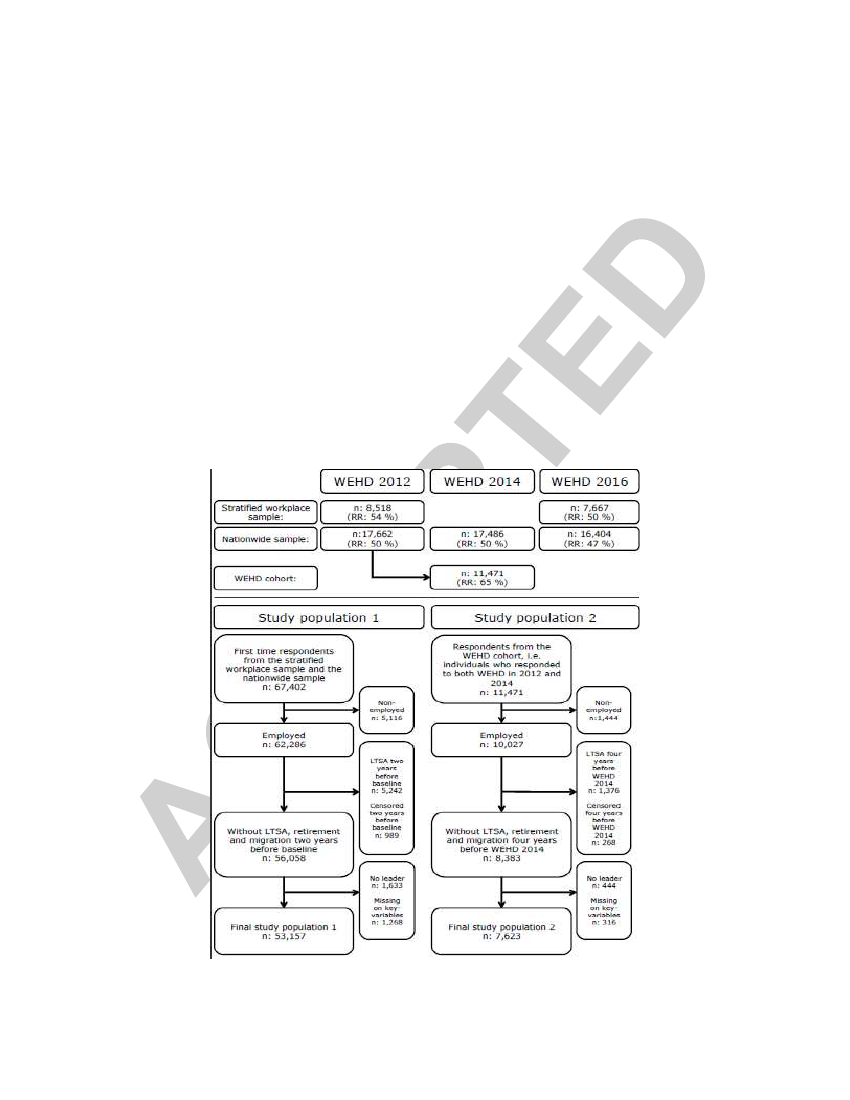
Figure 1 presents data source and flowcharts for study population 1 and 2. Study population 1
included all first time respondents from the 2012, 2014 and 2016 waves, a total of 67,402
individuals. The average response rate was 50%. We excluded 5,116 respondents reporting non-
employment at baseline (i.e. the date individuals filled in the questionnaire), 5,242 respondents
with LTSA during the two years before or at baseline, 989 respondents who received either
retirement benefits or disability pension or emigrated during the two years before baseline, 1,633
respondents without a leader, and 1,268 respondents with missing data on key variables
including leadership quality (n=631), yielding a final sample of 53,157 participants in study
population 1.
Study population 2 included 11,471 individuals who responded to both the 2012 and 2014 wave.
We excluded respondents reporting non-employment in 2012 or 2014 (n=1,444), had LTSA
(n=1,376) or received retirement benefits, disability pension or migrated (n=268) in the four-
year time period ranging from two years before filling in the questionnaire in the 2012 wave until
filling in the questionnaire in the 2014 wave, reported that they had no leader (n=444), and had
missing data on key variables (n=316), yielding a final sample of 7,623 respondents in study
population 2.
Measurement of leadership quality
Leadership
quality was measured with eight items developed for WEHD: How often … (Q1)
“does your immediate manager explain the company's objectives so you understand what they
mean for your work tasks?“; (Q2) “do you have sufficient authority in relation to your
BEU, Alm.del - 2019-20 - Bilag 243: Orientering om resultater fra en NFA-artikel om ledelseskvalitet og langtidssygefravær, fra beskæftigelsesministeren
responsibilities
at work?”; (Q3) “does your immediate manager take the time to engage in your
professional development?”; (Q4) “does your immediate manager involve you in the planning of
your work?”; (Q5) “does your immediate manager give you the necessary
feedback (praise and
criticism) for your work?”; (Q6) “is your work recognized and appreciated by the
management?”; (Q7) “do you get the necessary help and support from your immediate
manager?”; (Q8) “can you trust the information that comes from the management?”.
Response categories for all items were “Never” (1), “Seldom” (2), “Sometimes” (3), “Often” (4)
and “Always” (5). Scores were summed for all participants with non-missing
values on four or
more leadership quality items, resulting in a scale with a potential range from 8 to 40 points, with
higher scores indicating better leadership quality. Participants with missing values on three or
less leadership quality items were assigned the mean score of their non-missing items. In total
52,800 (99.3 %) responded to all eight items.
In study population 1, we categorized the leadership quality score into four groups based on the
quartiles within the study population (1st quartile=23.0, 2nd quartile=27.0, and 3rd
quartile=32.0) and labelled the groups: “Low leadership quality” (8.0≤score<23.0, mean=18.6,
SD=3.1); “Medium-low leadership quality” (23.0≤score≤27.0, mean=25.1, SD=1.4); “Medium-
high leadership quality” (27<score≤32.0, mean=30.0, SD=1.4); and “High leadership quality”
(32<score≤ 40.0, mean=35.9, SD=2.3).
In study population 2, we categorized the leadership quality score by median split as high
(≥median) or low (<median) leadership quality in 2012 (median=28.0) and 2014 (median=27.0),
respectively. We then categorized the respondents into four groups based on the level of
leadership quality (high or low) in 2012 and 2014: “Persistent high leadership quality”; “Change
from high to low leadership quality”; “Change from low leadership to high leadership quality“;
and “Persistent low leadership quality”.
In study population 2, we categorized the leadership quality score by median split as high or low
leadership quality in 2012 (median=28.0) and 2014 (median=27.0), respectively. We then
categorized the respondents into four groups based on the level of leadership quality (high or
low) in 2012 and 2014: “Persistent high leadership quality”; “Change from high to low
leadership quality”; “Change from low leadership to high leadership quality“; and “Persistent
low leadership quality”.
BEU, Alm.del - 2019-20 - Bilag 243: Orientering om resultater fra en NFA-artikel om ledelseskvalitet og langtidssygefravær, fra beskæftigelsesministeren
The leadership quality items was developed for the WEHD questionnaire and its psychometric
properties as a scale have not previously been tested. Therefore, we conducted a factor analysis
(rotation method: varimax) in population 1. The eight items loaded on one global factor with an
eigenvalue of 4.57 and all rotated factor loadings ranged from 0.63 to 0.84, confirming the
unidimensionality of the scale. The internal consistency of the scale was high with a Cronbach‟s
alpha of 0.89.
Measurement of LTSA
Using the respondents‟ unique
civil registration number, the WEHD questionnaire data was
linked to the DREAM register (Danish Register-Based Evaluation of Marginalization). DREAM
contains weekly information on all social transfer payments in Denmark since 1991, and
retirement, maternity leave, emigration, death and all compensation granted for sickness absence
since 1996.
15
The type of social transfer payment is reported per week for each person.
We defined LTSA as any
sickness absence spell lasting 30 days or more (≥ 6 weeks). The reason
for this cut-off point was that of January 2012 only sickness absence spells of 30 days or more
were reimbursed by the municipality and subsequently registered in DREAM. We assessed the
first episode of six or more consecutive weeks of sickness absence for each individual during 12
month (52 weeks) follow-up after baseline. We used the same definition of LTSA for study
population 1 and 2.
Measurement of covariates
As covariates we included sex (men or women), age (continuous), highest completed education
in four categories (high; middle-high; middle-low; or low), according to the International
Standard Classification of Education (ISCED),
16
cohabitation (yes/no), number of children living
at home (no children; at least one child younger than 8 years old; or at least one child aged 8 to
17 while no children younger than 8 years old in the household), and sector of employment
(private or public). We selected these covariates, as they are associated with risk of LTSA in
Denmark.
10, 11, 17
Information on sex, age, education, cohabitation and children was retrieved
from population based registers.
18-21
Information on sector of employment was retrieved from the
Integrated Database for Labor Market Research.
22
We further included job type defined by one-
digit DISCO-08 number, the Danish version of the International Standard Classification of
Occupations‟ (ISCO-08)
system,
23
and industry by using the codes of the Danish version of the
EU‟s nomenclature (NACE, Statistical classification of economic activities in the European
Community) from Statistics Denmark.
24
We used “the standard industrial grouping for
publishing purposes” that
aggregates the 726 possible industries into 10 groups. We included job
type and industry as previous research suggest that job type is associated with participation in
BEU, Alm.del - 2019-20 - Bilag 243: Orientering om resultater fra en NFA-artikel om ledelseskvalitet og langtidssygefravær, fra beskæftigelsesministeren
WEHD
14
and we expected that reported leadership quality might differ between employees in
different industries.
Statistical analysis
Using Cox proportional regression models, we estimated hazard ratios (HR) and 95% confidence
intervals (95% CI) for the association between exposure to different levels of leadership quality
reported at baseline and risk of LTSA during a 12 months follow-up period with calendar time as
the underlying time axis. Participants were followed from the date of first time questionnaire
completion (study population 1) and the second time questionnaire completion (study population
2), respectively, until first episode of LTSA or censoring due to statutory retirement, voluntary
early retirement, disability pension, emigration, death or end of follow-up, whichever came first.
We calculated cases per 1,000 person years, crude estimates and estimates adjusted for sex, age,
education, cohabitation and children living at home, sector of employment, job type, industry
and type of sample (stratified workplace sample or nationwide sample). Because we used
calendar time as the underlying time axis in the analyses, estimates were also adjusted for the
year participants filled in the questionnaire accounting for trends in sickness absence over time
and design differences between the three WEHD waves.
Proportional hazard assumptions for leadership quality and covariates were visually inspected
using Log-Log curves. We found no indication of violation of the proportional hazard
assumption.
In study population 1 we tested for a dose-response relationship between lower levels of
leadership quality and risk of LTSA by estimating the fully adjusted HR (95% CI) for one unit
decrease in the categorized leadership quality groups. Further, we tested if low leadership quality
predicted risk of LTSA differently depending on sex, age, educational attainment and sector of
employment by repeating the analyses separately for men and women, age groups (18-29, 30-44,
45-54, 55-64 years), the four educational groups (low, middle-low, middle-high, high) and labor
market sector (employment in private or public sector).
In study population 2, we examined the association between changes in leadership quality from
the 2012 to the 2014 survey and risk of LTSA in the 12 months after the 2014 survey. We
estimated adjusted HRs (95% CI) for subsequent risk of LTSA among respondents experiencing
persistent low leadership quality, a change from low to high leadership quality, and change from
high to low leadership quality between 2012 and 2014 compared to respondents with persistent
high leadership quality between 2012 and 2014. We used the same covariates as in the analysis
on study population 1.
BEU, Alm.del - 2019-20 - Bilag 243: Orientering om resultater fra en NFA-artikel om ledelseskvalitet og langtidssygefravær, fra beskæftigelsesministeren
Sensitivity analysis
We conducted two sensitivity analysis among the respondents from study population 1. First, to
test for reversed causation we excluded cases of LTSA during the first 6 month of follow-up
(n=1,823). We then estimated HR and 95% CI for the association between low leadership quality
at baseline and risk of LTSA from 6 months after baseline until 12 months after baseline.
Second, we examined the association between the eight leadership quality items separately and
risk of LTSA. We standardized the eight items and the leadership quality score with a mean of
zero and a standard deviation of one and estimated HR and 95% CI for LTSA per one standard
deviation decrease in the leadership quality item i.e. from higher to lower leadership quality
score during 12 months of follow-up. Estimates were adjusted for the same covariates as in the
analysis on study population 1. This analysis was limited to respondents from study population 1
without missing values on any of the eight leadership quality items (n: 52,800).
RESULTS
Characteristics of the study populations
Table 1
shows the baseline characteristics of the two study populations. In study population 1
slightly more than half were men (52.5%), mean age was 45.0 years (SD=11.3) and the majority
was employed in the private sector (57.6%). Most participants had middle-low education (upper
and post-secondary education, 43.6%), were cohabiting (77.9%), had no children living at home
(55.2%), where professionals (31.7%), and were working with public administration, education
and health (39.7%). The mean leadership quality score was 27.3 (SD=6.5) and similar across the
study participants‟ characteristics. In comparison
with study population 1, participants in study
population 2 were more often women (53.4%) and had a higher mean age of 47.8 (SD=10.0).
Leadership quality and predicted risk of LTSA in study population 1
During 51,155 person years, we identified 2,270 cases of LTSA (44 cases per 1,000 person-
years). Among LTSA cases, the mean time from baseline to LTSA was 26.7 weeks (0.51 years).
Participants were censored during follow-up due to statutory retirement pension (n: 734),
voluntary early retirement (n: 933), disability pension (n: 80), emigration (n: 216) or death (n:
282).
BEU, Alm.del - 2019-20 - Bilag 243: Orientering om resultater fra en NFA-artikel om ledelseskvalitet og langtidssygefravær, fra beskæftigelsesministeren
Table 2
shows LTSA cases per 1,000 person-years and the crude and adjusted hazard ratios of
the association between exposure to levels of leadership quality at baseline and onset of LTSA
during follow-up. The number of LTSA cases per 1,000 person-years was 36, 38, 43 and 60 for
high, medium-high, medium-low and low leadership quality, respectively. The corresponding
adjusted hazard ratios were 1.09 (95% CI: 0.96-1.24), 1.19 (95% CI: 1.05-1.35) and 1.61 (95%
CI: 1.43-1.82), respectively. There was a dose-response association between lower leadership
quality scores and higher risk of LTSA. For each one unit decrease in the level of leadership
quality (from higher to lower levels), the adjusted HR for LTSA was 1.17 (95% CI: 1.13-1.22).
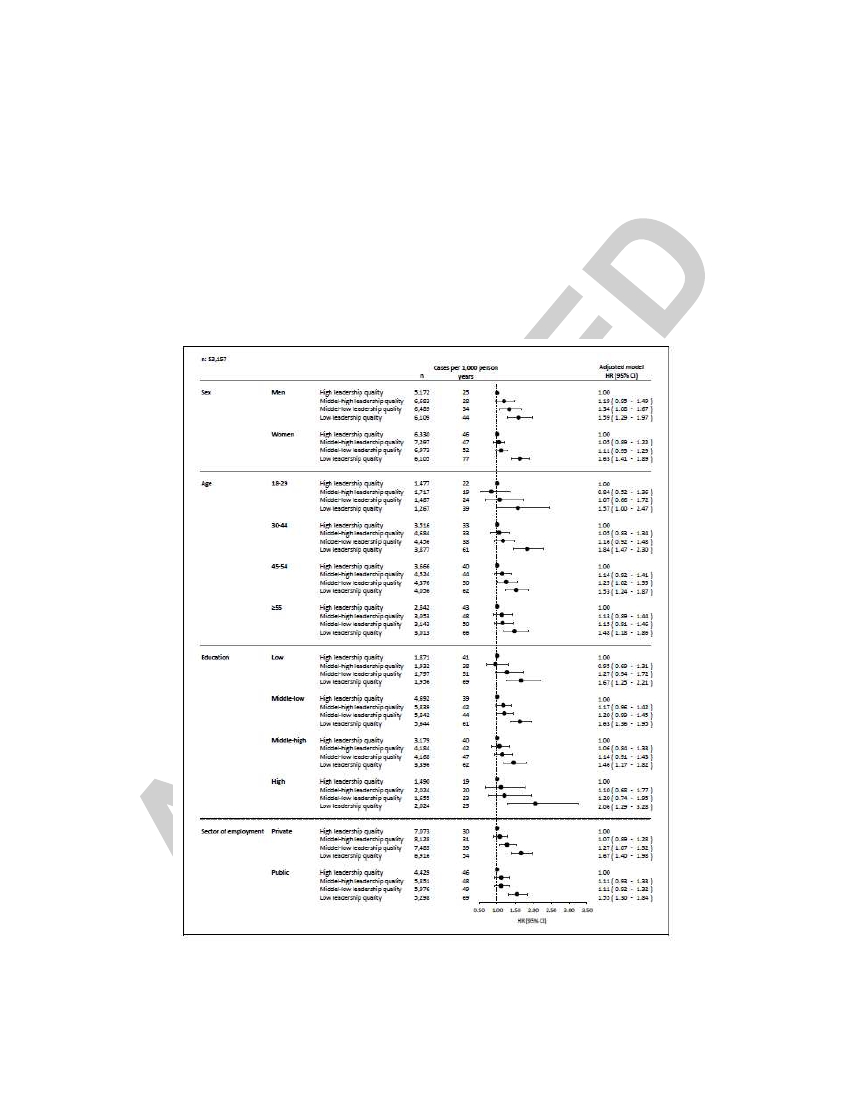
Leadership quality and LTSA separately for men and women, age groups, educational
level and sector of employment in study population 1
Figure 2
shows the association between leadership quality and risk of LTSA separately for men
and women, age groups, educational level, and sector of employment. Low leadership quality
predicted risk of LTSA in both men and women, in all age groups, at all educational levels and
among employees in the private and public sector. We found no indication of interactions
between leadership quality and sex (p-value: 0.37), age groups (p-value: 0.55), educational level
(p-value: 0.86), or sector of employment (p-value: 0.48).
Change in leadership quality and predicted risk of LTSA in study population 2
Table 3
shows for study population 2 LTSA cases per 1,000 person-years and the crude and
adjusted hazard ratios for the association between changes in leadership quality from the 2012 to
the 2014 survey and onset of LTSA during 12 months follow-up after the 2014 survey. The
number of LTSA cases per 1,000 person-years was 36, 46, 50 and 32 for persistent high
leadership quality, persistent low leadership quality, change from high to low leadership quality,
and change from low to high leadership quality, respectively. Compared to persistent high
leadership quality change from high leadership quality to low leadership quality predicted risk of
LTSA with a HR of 1.42 (95% CI: 1.02-1.97). Persistent low compared to persistent high
leadership quality was associated with risk of LTSA with a HR of 1.28 (95% CI: 0.97-1.69).
The risk of LTSA in employees changing from low to high leadership quality was similar to that
of employees with persistent high leadership quality (HR=0.90, 95% CI: 0.71-1.47).
Sensitivity analysis
When we excluded cases during the first 6 months of follow-up, results were similar to the main
analyses (Online-table
1,
http://links.lww.com/JOM/A751).
BEU, Alm.del - 2019-20 - Bilag 243: Orientering om resultater fra en NFA-artikel om ledelseskvalitet og langtidssygefravær, fra beskæftigelsesministeren
When we analyzed the eight leadership quality items, separately, we found that a one standard
deviation decrease in the score predicted risk of LTSA for all eight items with adjusted HRs
ranging from 1.11 to 1.22 (Online-figure
1,
http://links.lww.com/JOM/A752). We found the
strongest associations for items concerning authority in relation to responsibility (Q2),
recognition and appreciation by the management (Q6), help and support from the immediate
manager (Q7), and trusting information from the management (Q8). A one standard deviation
decrease in the total leadership quality score predicted risk of LTSA with an adjusted HR of 1.23
(95% CI: 1.18-1.28) (Online-figure
1,
http://links.lww.com/JOM/A752).
DISCUSSION
Summary of results
This study of 53,157 employees from a wide range of job types and industries in Denmark
showed that during 12 month of follow-up low leadership quality, compared to high leadership
quality, was associated with higher risk of onset of LTSA, measured as six or more consecutive
weeks of sickness absence. There was a clear dose-response association between lower levels of
leadership quality and higher risk of LTSA. Low leadership quality predicted a higher risk of
LTSA in both men and women, in all age groups, at all educational levels, and among employees
in the private and public sector.
In a subsample of 7,623 employees with repeated measurements of leadership quality, change
from high to low leadership quality was associated with higher risk of onset of LTSA compared
to persistent high leadership quality. The increased risk of LTSA among employees who had
experienced a worsening in leadership quality suggest that the association between low
leadership quality and risk of LTSA is mainly driven by workplace conditions and not by
personality traits of the respondents.
Comparison with previous research
Previous research on leadership quality and risk of LTSA has shown inconsistent results, with
some studies reporting associations and other studies not or only in subgroups.
8-13
For example, a
Danish study by Clausen et al. reported that low compared to high leadership quality predicted
risk of LTSA with a HR of 1.21 (95% CI: 1.12-1.31) among 39,408 employees from four
occupational groups.
8
The slightly stronger estimate in our study (HR: 1.61, 95% CI: 1.43-1.82)
may be due to (i) differences in the items measuring leadership quality, (ii) higher exposure
contrast in our study (categorization into tertiles by Clausen et al. and into quartiles in our study)
and (iii) different definitions of LTSA (≥3
weeks and ≥6 weeks, respectively).
BEU, Alm.del - 2019-20 - Bilag 243: Orientering om resultater fra en NFA-artikel om ledelseskvalitet og langtidssygefravær, fra beskæftigelsesministeren
Another Danish study by Lund et al reported that a higher degree of leadership quality was
associated with a lower risk of LTSA among women but not among for men.
12
In our study,
though, we found associations in both women and men. A reason for this difference may be the
different sample sizes of the two studies. Our sample was ten times larger (53,157 vs. 5,357) and
the amount of LTSA cases was nearly six times larger (2,270 vs 359) compared to the study by
Lund et al. Consequently, our study had higher statistical power, increasing the chances to detect
also small associations and to estimate associations with a high level of precision.
Strengths and limitations
The strengths of this study are the large dataset with 53,157 employees representing a wide range
of job types and industries in the Danish workforce. The use of register-based LTSA ensured
almost no loss to follow-up. To our knowledge, this is the largest study on the association
between leadership quality and sickness absence to date. The large number of participants and
cases allowed us to conduct subgroup analyses demonstrating that associations between
leadership quality and LTSA was similar for men and women and across age groups, educational
groups and sector of employment.
The leadership quality score used in this study was a newly developed tool for WEHD and had
not been tested previously. We therefore conducted a factor analysis of the scale before
analyzing the association between leadership quality and LTSA. The items of the scale loaded on
one global factor, the internal consistency of the scale was high and a Cronbach‟s alpha of 0.89
indicated a high degree of correlation between the items. A sensitivity analysis showed that all
eight items predicted LTSA in the same direction and contributed to the ability of the leadership
quality scale to predict LTSA. Thus, although the leadership quality scale was not tested
previously, it turned out as a reliable scale with predictive validity regarding risk of LTSA.
To ensure that our results were not affected by reverse causation we conducted a sensitivity
analysis excluding LTSA events during the first 6 month after baseline. The analysis showed
similar estimates with an increased risk of LTSA among participants reporting low leadership
quality, indicating that the association between leadership quality and risk of LTSA is not due to
reverse causation.
Several limitations of the study should be noted. First, the Danish registers do not include cause
of LTSA and consequently we do not know whether a participant was sick due to a somatic
disease or mental disorder. Consequently, we were not able to analyze whether low leadership
BEU, Alm.del - 2019-20 - Bilag 243: Orientering om resultater fra en NFA-artikel om ledelseskvalitet og langtidssygefravær, fra beskæftigelsesministeren
quality predicted LTSA due to a somatic disease or mental disorder differently, which could be
important to clarify as low leadership quality previously has been associated with an increased
risk of both ischemic heart diseases and depressive disorder.
25, 26
Second, our study was limited
to spells of sickness absence of six weeks or more as sickness absence in DREAM is registered
when the employee‟s salary after 30 days is reimbursed by the municipalities. Long-term
and
short-term sickness absence may have different causes and therefore our results cannot be
generalized to all types of sickness absence. Third, the baseline response rate in the three WEHD
waves of 54 %, 50 % and 50 %, respectively may raise concerns about the representativeness of
the results. A recent analysis conducted on the 2012 WEHD wave showed that sex, age,
cohabitations, education and job type were associated with the likelihood of responding to the
questionnaire in 2012,
14
and consequently we adjusted for these variables in the analyses.
Finally, it is unclear whether our results are generalizable to employees in other countries with
different sickness absence legislations. As our study, like most previous research on work
environment and LTSA, has been conducted in a Nordic country, future prospective studies on
leadership quality and LTSA in other than Nordic countries is encouraged.
We did not adjust the estimates for other psychosocial work conditions, even though previous
research has shown associations between other psychosocial work environment factors and risk
of LTSA,
8, 10, 13, 27
including a study using the WEHD data that found an association between
high emotional demands and LTSA.
27
We refrained from these adjustments, because we
reasoned that low leadership quality may cause the occurrence of several potentially adverse
psychosocial work environment factors, for example high quantitative demands, high emotional
demands, low job control, or even workplace bullying.
3
Thus, these other psychosocial work
environment factors might not be confounders but mediators in the causal pathway linking low
exposure to leadership quality with risk of LTSA, which would make statistical adjustment
inappropriate. We suggest that future studies investigate how psychosocial working conditions
may mediate the association between leadership quality and LTSA.
Conclusion
Low leadership quality predicted an increased risk of LTSA in a large nationwide sample of
employees in Denmark. Associations were similar across men and women, age groups,
educational levels, and sector of employment. Compared to persistent high leadership quality a
change from high to low leadership quality two years apart predicted a higher risk of LTSA
indicating that the increased risk of LTSA is likely related to workplace conditions rather than
individual traits of the employees. As we found that low leadership quality predicted a 1.61 fold
increased risk of LTSA, measured as six or more weeks of sickness absence, leadership quality
may be considered an important social stressor at work whit considerable consequences.
Therefore, future intervention studies should examine if improving leadership quality can reduce
LTSA among employees.
BEU, Alm.del - 2019-20 - Bilag 243: Orientering om resultater fra en NFA-artikel om ledelseskvalitet og langtidssygefravær, fra beskæftigelsesministeren
Reference
1. Pejtersen JH, Kristensen TS, Borg V, Bjorner JB. The second version of the Copenhagen
Psychosocial Questionnaire. Scand J Public Health. 2010;38:8-24
2. Schaufeli WB, Bakker AB. Job demands, job resources, and their relationship with burnout
and engagement: A multi-sample study. Journal of Organizational Behavior. 2004;25:293-315
3. Hauge LJ, Einarsen S, Knardahl S, Lau B, Notelaers G, Skogstad A. Leadership and role
stressors as departmental Level predictors of workplace bullying. Int J Stress Manag.
2011;18:305-323
4. Semmer NK, Jacobshagen N, Meier LL, Elfering A. Occupational Stress Research: The
"Stress-as-offense-to-self" perspective. In: Houdmont J, Scott M, editors. Occupational Health
Psychology: European perspectives on research education and practice. Nottingham: Nottingham
University Press; 2007. p. 43-60.
5. Amiri S, Behnezhad S. Depression and risk of disability pension: A systematic review and
meta-analysis. Int J Psychiatry Med. 2019;91217419837412
6. Walker ER, McGee RE, Druss BG. Mortality in mental disorders and global disease burden
implications: a systematic review and meta-analysis. JAMA Psychiatry. 2015;72:334-341
7. Lovelace JB, Neely BH, Allen JB, Hunter ST. Charismatic, ideological, & pragmatic (CIP)
model of leadership: A critical review and agenda for future research. Leadersh. Q. 2019;30:96-
110
8. Clausen T, Burr H, Borg V. Do psychosocial job demands and job resources predict long-term
sickness absence? An analysis of register-based outcomes using pooled data on 39,408
individuals in four occupational groups. Int Arch Occup Environ Health. 2014;87:909-917
BEU, Alm.del - 2019-20 - Bilag 243: Orientering om resultater fra en NFA-artikel om ledelseskvalitet og langtidssygefravær, fra beskæftigelsesministeren
9. Aagestad C, Johannessen HA, Tynes T, Gravseth HM, Sterud T. Work-related psychosocial
risk factors for long-term sick leave: A prospective study of the general working population in
Norway. J Occup Environ Med. 2014;56:787-793
10. Labriola M, Christensen KB, Lund T, Nielsen ML, Diderichsen F. Multilevel analysis of
workplace and individual risk factors for long-term sickness absence. J Occup Environ Med.
2006;48:923-929
11. Rugulies R, Aust B, Pejtersen JH. Do psychosocial work environment factors measured with
scales from the Copenhagen Psychosocial Questionnaire predict register-based sickness absence
of 3 weeks or more in Denmark? Scand J Public Health. 2010;38 Suppl 3:42-50
12. Lund T, Labriola M, Christensen KB, Bültmann U, Villadsen E, Burr H. Psychosocial work
environment exposures as risk factors for long-term sickness absence among Danish employees:
results from DWECS/DREAM. J Occup Environ Med. 2005;47:1141-1147
13. Clausen T, Nielsen K, Carneiro IG, Borg V. Job demands, job resources and long-term
sickness absence in the Danish eldercare services: a prospective analysis of register-based
outcomes. J Adv Nurs. 2012;68:127-136
14. Johnsen NF, Thomsen BL, Hansen JV, Christensen BS, Rugulies R, Schlünssen V. Job type
and other socio-demographic factors associated with participation in a national, cross-sectional
study of Danish employees. BMJ Open. 2019;9:e027056
15. Burr H, Pedersen J, Hansen JV. Work environment as predictor of long-term sickness
absence: Linkage of self-reported DWECS data with the DREAM register. Scand J Public
Health. 2011;39 Suppl 7:147-152
16. United Nations Educational Scientific and Cultural Organization (UNESCO). International
Standard Classification of Education (ISCED 1997). 1997.
BEU, Alm.del - 2019-20 - Bilag 243: Orientering om resultater fra en NFA-artikel om ledelseskvalitet og langtidssygefravær, fra beskæftigelsesministeren
http://www.unesco.org/education/information/nfsunesco/doc/isced_1997.htm. Accessed 22 May
2019.
17. Nielsen ML, Rugulies R, Christensen KB, Smith-Hansen L, Kristensen TS. Psychosocial
work environment predictors of short and long spells of sickness absence during a two-year
follow-up. J Occup Environ Med. 2006;48:591-598
18. Pedersen CB. The Danish Civil Registration System. Scand J Public Health. 2011;39:22-25
19. Jensen VM, Rasmussen AW. Danish Education Registers. Scand J Public Health.
2011;39:91-94
20. Statistics Denmark. Documentation of statistics: Population and elections. 2019.
https://www.dst.dk/en/Statistik/dokumentation/documentationofstatistics?subject=02. Accessed
22 May 2019.
21. Statistics Denmark. Documentation of statistics: Households, families and children. 2019.
https://www.dst.dk/en/Statistik/dokumentation/documentationofstatistics/households--families-
and-children. Accessed 22 May 2019.
22. Petersson F, Baadsgaard M, Thygesen LC. Danish registers on personal labour market
affiliation. Scand J Public Health. 2011;39:95-98
23. International Labour Organization. ISCO-08 Structure, index correspondence with ISCO-88.
2018. http://www.ilo.org/public/english/bureau/stat/isco/isco08/. Accessed 20 November 2018.
24. Torma K, Simbold CT, Sørensen AG, Madsen KK, Skjelbo K. Dansk Branchekode 2007,
DB07 Copenhagen: Statistics Denmark; 2007.
25. Rugulies R, Jakobsen LM, Madsen IEH, Borg V, Carneiro IG, Aust B. Managerial quality
and risk of depressive disorders among Danish eldercare workers: A multilevel cohort study. J
Occup Environ Med. 2018;60:120-125
BEU, Alm.del - 2019-20 - Bilag 243: Orientering om resultater fra en NFA-artikel om ledelseskvalitet og langtidssygefravær, fra beskæftigelsesministeren
26. Nyberg A, Alfredsson L, Theorell T, Westerlund H, Vahtera J, Kivimäki M. Managerial
leadership and ischaemic heart disease among employees: the Swedish WOLF study. Occup
Environ Med. 2009;66:51-55
27. Framke E, Sørensen JK, Nordentoft M, et al. Perceived and content-related emotional
demands at work and risk of long-term sickness absence in the Danish workforce: a cohort study
of 26 410 Danish employees. Occup Environ Med. 2019;76:895-900
Figure 1. Data sources and flowcharts for creating study population 1 and study population
2
LTSA: Long-term sickness absence, RR: Response rate, WEHD: Work Environment and Health
in Denmark
BEU, Alm.del - 2019-20 - Bilag 243: Orientering om resultater fra en NFA-artikel om ledelseskvalitet og langtidssygefravær, fra beskæftigelsesministeren
Figure 2. Association between leadership quality and long-term sickness absence during
12-months follow-up by sex, age groups, educational groups and sector of employment
among 53,157 employees (study population 1)
Estimates are adjusted for sex, age, cohabitation, children, educational level and sector of
employment (private or public, and type of sample (nationwide sample or stratified workplace
sample). As calendar time was the underlying time axis, estimates are also adjusted for year of
survey and design differences between the three waves. PY: Person years, HR: Hazard ratio, CI:
Confidence intervals
BEU, Alm.del - 2019-20 - Bilag 243: Orientering om resultater fra en NFA-artikel om ledelseskvalitet og langtidssygefravær, fra beskæftigelsesministeren
Table 1. Characteristics of the study population at baseline and average leadership quality in study
population 1 (n=53,157) and study population 2 (n=7,623)
Study population 1
N
% Mean leadership
quality (SD)
Sex
Men
Women
Age (mean 45.0 / 47.8)
18-29
30-44
45-54
≥55
Cohabitation
Yes
No
Children living at home
No children
At least one child aged 0-7 years
At least one child aged 8-17 years
(no children < 8
years)
Educational level
High (Second state tertiary)
Middle-high (First stage tertiary)
Middle-low (Upper and post-
secondary)
Low (Primary lower secondary)
Sector of employment
Private
Public
Job type
Commissioned armed forces
officers
Managers
Professionals
Technicians and associate
professionals
General office clerks
Personal services workers
Skilled agricultural, forestry and
fishery
workers
Building and related trades
workers
Plant and machine operators and
assemblers
Study population 2
N
% Mean leadership
quality (SD)
in 2012
3,555
4,068
46.7
53.4
27.1 (6.3)
27.7 (6.3)
27,891
25,266
52.5
47.5
27.5 (6.5)
27.0 (6.5)
6,096
16,971
17,120
12,970
11.5
31.9
32.2
24.4
27.7 (6.5)
27.2 (6.4)
27.2 (6.6)
27.2 (6.7)
423
2,224
2,703
2,273
5.5
29.2
35.5
30.0
28.0 (6.3)
27.3 (6.1)
27.3 (6.2)
27.2 (6.5)
41,428
11,729
77.9
22.1
27.4 (6.5)
26.8 (6.7)
6,131
1,492
80.4
19.6
27.5 (6.3)
27.0 (6.4)
29,341
10,479
13,337
55.2
19.7
25.1
27.2 (6.7)
27.3 (6.3)
27.5 (6.4)
4,374
1,320
1,929
57.4
17.3
25.3
27.4 (6.4)
27.4 (6.4)
27.4 (6.1)
6,560
15,531
23,187
7,879
12.3
29.2
43.6
14.8
27.9 (6.1)
27.3 (6.3)
27.1 (6.7)
27.3 (7.0)
1,094
2,513
3,194
822
14.4
33.0
41.9
10.8
28.0 (6.0)
27.4 (6.1)
27.2 (6.4)
27.2 (6.7)
30,621
22,536
57.6
42.4
27.4 (6.7)
27.0 (6.4)
4,231
3,392
55.5
44.5
27.5 (6.3)
27.2 (6.2)
315
2,474
16,839
7,198
4,915
7,930
318
0.6
4.7
31.7
13.5
9.3
14.9
0.6
27.6 (5.8)
28.9 (6.3)
27.5 (6.1)
27.5 (6.2)
27.2 (6.6)
27.3 (6.8)
27.7 (7.0)
58
339
2,712
1,152
723
1,000
22
0.8
4.5
35.6
15.1
9.5
13.1
0.3
26.6 (5.4)
29.1 (6.0)
27.3 (6.1)
27.0 (6.2)
27.0 (6.6)
27.3 (6.7)
28.7 (5.9)
4,348
3,047
8.2
5.7
26.0 (6.6)
25.3 (7.1)
501
335
6.6
4.4
25.7 (6.2)
25.3 (7.0)
BEU, Alm.del - 2019-20 - Bilag 243: Orientering om resultater fra en NFA-artikel om ledelseskvalitet og langtidssygefravær, fra beskæftigelsesministeren
Elementary occupations
Unknown job type
Industry
Agriculture, forestry and fishing
Manufacturing, mining and
quarrying
and utility service
Construction
Trade and transport
Information and communication
Financial and insurance
Real estate
Other business services
Public administration, education
and
health
Arts, entertainment and other
services
Unknown industry
Sample type
Nationwide sample
Stratified workplace sample
Leadership quality (Score)
High (4. quartile)
Middle-high (3. quartile)
Middle-low (2. quartile)
Low (1. quartile)
Change in leadership quality
between 2012 and 2014
Persistent high leadership quality
Persistent low leadership quality
Change from high to low
leadership
quality
Change from low to high
leadership
quality
3,784
1,989
7.1
3.7
26.8 (7.1)
28.9 (7.0)
391
390
5.1
5.1
26.2 (7.1)
28.6 (6.8)
582
8,766
1.1
16.5
28.9 (6.7)
26.7 (6.6)
75
1,078
1.0
14.1
29.5 (6.5)
26.8 (6.6)
2,886
8,969
1,894
1,894
541
4,672
21,081
5.4
16.9
3.6
3.6
1.0
8.8
39.7
26.9 (6.6)
27.2 (6.9)
27.9 (6.1)
29.2 (5.7)
27.3 (6.7)
27.6 (6.5)
27.2 (6.4)
271
1,286
331
333
111
671
3,160
3.6
16.9
4.3
4.4
1.5
8.8
41.5
27.0 (6.5)
27.0 (6.6)
27.6 (6.0)
28.4 (5.7)
27.0 (6.4)
27.8 (6.4)
26.8 (6.3)
1.855
17
3.5
1.0
27.7 (6.8)
26.6 (7.3)
302
5
4.0
0.1
27.8 (7.1)
26.6 (10.4)
40,427
12,730
53,157
12,800
13,980
14,470
11,907
76.0
24.0
100.0
24.1
26.3
27.2
22.4
27.4 (6.5)
26.9 (6.6)
27.3 (6.5)
35.9 (2.3)
30.0 (1.4)
25.1 (1.4)
18.6 (3.1)
7,623
100.0
27.4 (6.3)
2,607
2,764
1,213
34.2
36.3
15.9
33.1 (3.4)
21.7 (4.0)
31.2 (2.9)
1,039
13.6
23.6 (3.5)
SD: Standard deviation
BEU, Alm.del - 2019-20 - Bilag 243: Orientering om resultater fra en NFA-artikel om ledelseskvalitet og langtidssygefravær, fra beskæftigelsesministeren
Table 2. Association between exposure to different levels of leadership quality at baseline and onset
of long-term sickness absence during 12-months follow-up among 53,157 employees (study
population 1)
Person-
years
(PY)
Leadership quality
High leadership quality
Medium-high leadership quality
Medium-low leadership quality
Low leadership quality
Dose-response
Decrease in the level of leadership
quality (from higher to lower levels)
Cases
Cases
per
1,000
PY
36
38
43
60
Crude
HR (95% CI)
Adjusted*
HR (95% CI)
11,501
13,979
13,461
12,214
416
535
581
738
1.00
1.06 (0.93-1.20)
1.19 (1.05-1.35)
1.67 (1.48-1.88)
1.00
1.09 (0.96-1.24)
1.19 (1.05-1.35)
1.61 (1.43-1.82)
51,155
2,270
44
1.19 (1.15-1.24)
1.17 (1.13-1.22)
*Adjusted for sex, age, cohabitation, children, educational level and sector of employment (private or public), job
type, industry, job type, industry, and type of sample (nationwide sample or stratified workplace sample). As
calendar time was the underlying time axis, estimates are also adjusted for year of survey and design differences
between the three waves. PY: Person years, HR: Hazard ratio, CI: Confidence intervals
Table 3. Association between changes in leadership quality from 2012 and 2014 and long-
term sickness absence during 12-months follow-up among 7,623 employees (study
population 2)
Person- Cases
years
(PY)
Change in leadership quality
Persistent high leadership
2,519
quality
Persistent low leadership quality 2,637
Change from high to low
leadership quality
Change from low to high
leadership quality
1,161
1,005
Cases
per
1,000
PY
36
46
50
32
Crude
HR (95% CI)
Adjusted*
HR (95% CI)
91
120
58
32
1.00
1.31 (1.01-1.70)
1.39 (1.00-1.99)
0.88 (0.59-1.32)
1.00
1.28 (0.97-
1.69)
1.42 (1.02-
1.97)
0.90 (0.60-
1.35)
*Adjusted for sex, age, cohabitation, children, educational level and sector of employment (private or
public), job type, industry, and type of sample (nationwide sample or stratified workplace sample). As
calendar time was the underlying time axis, estimates are also adjusted for year of survey and design
differences between the three waves. PY: Person years, HR: Hazard ratio, CI: Confidence intervals