Ligestillingsudvalget 2018-19 (1. samling)
LIU Alm.del Bilag 69
Offentligt
2041082_0001.png
Annex 2
Faroe Islands Statistical Data
Article 7
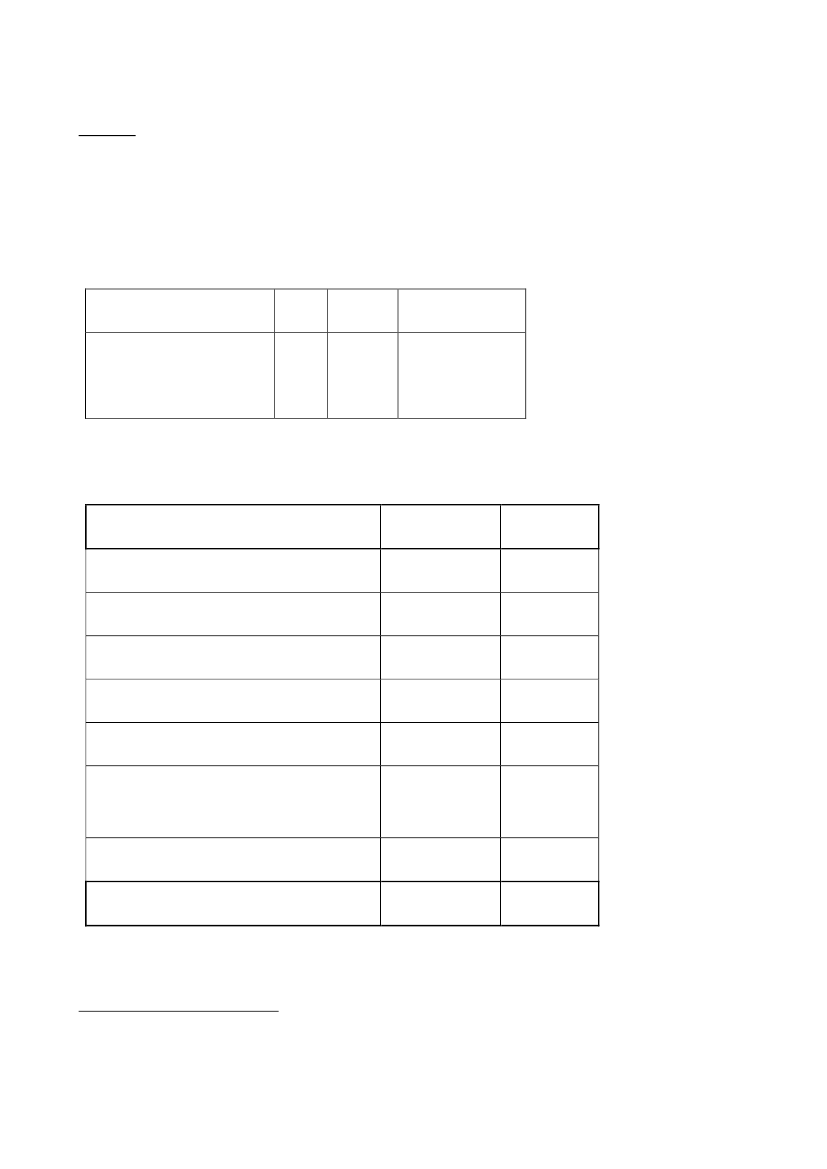
Table 1: Distribution by gender in Government
1
The Faroese Executive
2015
2011
Total Women Women in %
8
8
4
1
50%
12.5%
Table 2: Distribution by gender in Government Commissions and Boards 2016
2
Governmental Ministries
Prime Minister`s Office
Ministry of Social Affairs
Ministry of Fisheries
Ministry of Finance
Ministry of Health and the Interior
Ministry of Education, Research and
Culture
Ministry of Foreign Affairs and Trade
Total
41
36
39
59
64
61
Women in %
40
44
26
33
41
Men in %
60
56
74
67
59
1
2
Source: Faroese Prime Minisiter’s
Office
Source: Faroese
Prime Minister’s Office
LIU, Alm.del - 2018-19 (1. samling) - Bilag 69: Danmarks 9. periodiske rapport til FN's komite om afskaffelse af diskrimination af kvinder (CEDAW), fra ministeren for fiskeri og ligestilling
2041082_0002.png
Article 10
Table 3: Gender Distribution in the Faroese Public School System 2018/19
3
Class level Girls
1
2
3
4
5
6
7
8
9
10
Total
319
356
332
359
379
351
354
373
359
185
3367
Boys
351
369
356
370
344
352
396
362
386
210
3496
Girls % of total
47.7%
49.1%
48.2%
49.2%
52.4%
49.9%
47.2%
50.7%
48.1%
46.8%
49.1%
3
Source: Statistics Faroe Islands
LIU, Alm.del - 2018-19 (1. samling) - Bilag 69: Danmarks 9. periodiske rapport til FN's komite om afskaffelse af diskrimination af kvinder (CEDAW), fra ministeren for fiskeri og ligestilling
2041082_0003.png
Table 4: Secondary Education 2015/16 - by Gender
4
Girls
Students
1310
Boys
974
Total
2284
Girls % of total
57.3%
Table 5: Higher Education
by Gender and Place of Education
5
2015/16
Women
Faroes
502
Women in %
52%
57%
55%
Men Total
471
622
973
1459
2016/17
Women
539
773
1312
Women in %
53%
58%
56%
Men Total
484
564
1023
1337
Abroad
837
Total
1339
1093 2432
1048 2360
4
Source: The Faroese Student Grant Fund (Studni) dated October 2016. The figures are for persons studying in the
Faroe Islands were compiled on the basis of monthly student grants paid. All students who received student grants that
year are included in the above figures. The figures for persons studying abroad were compiled on the basis of the
number of students who received travel grants.
5
Source: The Faroese Student Grant Fund dated July 2017.
LIU, Alm.del - 2018-19 (1. samling) - Bilag 69: Danmarks 9. periodiske rapport til FN's komite om afskaffelse af diskrimination af kvinder (CEDAW), fra ministeren for fiskeri og ligestilling
2041082_0004.png
Arcticl 11
Table 6: Duration of unemployment (December 2018)
6
Duration of unemployment (%)
30
25
20
15
10
5
0
< 1 month
1-3 months
3-6 months
Men
Women
6-12 months
< 12 months
Table 7: Of the total wages paid in 2018, 37.4% were paid to women
7
Wage payments 2012
(DKK 1,000)
Agriculture
Fisheries
Fish farming
Natural resources
Men
15,812.2
1,004,785.4
263,523.5
53,345.7
Women
7,681.7
14,426.4
95,465.4
2.162,8
Total
23,493.7
1,019,212.1
358,989.0
55,508.7
Women in
%
32.6%
1.0%
26.5%
3.8%
6
7
Source: Statistics Faroe Islands
LIU, Alm.del - 2018-19 (1. samling) - Bilag 69: Danmarks 9. periodiske rapport til FN's komite om afskaffelse af diskrimination af kvinder (CEDAW), fra ministeren for fiskeri og ligestilling
2041082_0005.png
Fish productions
Shipyard, smithy
Other industry
Construction
Energy production
Commerce and maintenance
Hotels and restaurants
Maritime transport
Other transport
Post and telecommunication
Finance and insurance
Commercial services
Domestic services
Government
Municipal and other
institutions
Education
Health and social services
Organisations, culture etc,
Undisclosed
Total
252,616.7
256,563.5
214,326.9
775,795.3
63,454.1
511,155.5
65,752.6
379,888.2
252,710.5
99,181.1
171,952.9
275,468.0
46,250.6
150,072.3
140,397.5
17,910.6
70,777.4
47,717.2
10,937.4
325,390.1
84,825.5
54,674.1
81,140.6
41,031.7
180,026.0
105,452.2
53,273.3
129,082.0
393,014.4
274,474.3
285,104.4
823,512.5
74,391.5
836,545.7
150,578.4
434,562.0
333,851.0
140,212.8
351,979.4
380,920.4
99,523.9
279,154.2
35.7%
6.5%
24.8%
5.7%
14.7%
38.9%
56.3%
12.5%
24.3%
29.2%
51.1.3%
27.6%
53.5%
46.2%
347,415.2
297,539.8
246,091.7
146,440.0
18,148.1
5,908,290.6
670,919.8
365,036.7
928,590.9
91,873.1
18,612.2
3,537,405.1
1,018,335.4
662,576.3
1,174,682.9
238,313.2
36,760.2
9,445,695.9
65.9%
55.1%
79.1%
38.5%
50.6%
37.4%
LIU, Alm.del - 2018-19 (1. samling) - Bilag 69: Danmarks 9. periodiske rapport til FN's komite om afskaffelse af diskrimination af kvinder (CEDAW), fra ministeren for fiskeri og ligestilling
2041082_0006.png
Table 8: Average wage 2018 (DKK 1,000)
8
Total
Men Women
Agriculture
Fisheries
Fish farming
Natural resources
Fish productions
Boat building
Other industry
Construction
Energy production
Commerce and maintenance
Hotels and restaurants
Maritime transport
Other transport
395
976
517
601
433
425
428
418
493
395
289
571
534
362
367
361
344
300
297
306
366
416
250
233
333
376
average
384
955
464
581
373
414
389
415
480
323
254
527
484
Wage
difference
9.2%
166.2%
43.2%
74.6%
44.4%
43.1%
39.9%
14.2%
18.4%
58.4%
24.0%
71.4%
42.3%
8
Source: Statistics Faroe Islands. The counting of employees is based on the Faroes Custom and tax Authorities records
of current taxes, Faroese companies and on the national registration of the Ministry of the Interior. The figures include
Faroese citizens aged 16 to 74 years who are receiving wages over the pay-as-you-earn tax system. Included are only
those who have at least a monthly wage income equivalent of a days pay of a unskilled worker. Likewise, those are
included who are on leave because of childbirth or illness.
Because the payment of sailors in particular tends to vary, we count people as employees even if they receive no salary
for one or two months if they receive a salary again the following month.
Each month a number of workers receive salary from several different employers. To prevent double counting we group
the workers by industry according to where the biggest payment originated each respective month.
These rules have been applied by us in such a way as to comply with the rules of ILO in the best possible way and
therefore to be comparable with other countries.
LIU, Alm.del - 2018-19 (1. samling) - Bilag 69: Danmarks 9. periodiske rapport til FN's komite om afskaffelse af diskrimination af kvinder (CEDAW), fra ministeren for fiskeri og ligestilling
2041082_0007.png
Post and telecommunication
Finance and insurance
Commercial services
Domestic services
Government
Municipal and other
institutions
Education
Health and social services
Organisations. culture etc.
Undisclosed
Total
465
624
573
415
549
357
425
410
319
425
427
503
516
357
483
30.3%
46.9%
39.9%
30.1%
29.3%
421
499
528
436
1058
514
317
423
348
372
443
337
346
454
373
410
875
429
33.0%
18.1%
51.6%
17.2%
138.9%
52.3%
Article 12
Table 9: Population as of January 1
st
2014-2018
9
2014
Male
Female
Total
24,894
23,259
48,153
2016
25,378
23,743
49,121
2018
26,018
24,480
50,498
9
Source: Statistics Faroe Islands
LIU, Alm.del - 2018-19 (1. samling) - Bilag 69: Danmarks 9. periodiske rapport til FN's komite om afskaffelse af diskrimination af kvinder (CEDAW), fra ministeren for fiskeri og ligestilling
2041082_0008.png
Female in %
48,3
48,3
48,4
Table 10: Average Life Expectancy
2012-2013
79.1
83.9
81.4
2016
79.9
84.7
82.3
Male
Female
Average
Table 11: Free HPV-vaccinations
Age
0-11
12-20
21-65
Total
2016
4
119
5
128
2017
3
286
7
296
2018
4
563
13
580
Total
11
968
25
1004