NATO's Parlamentariske Forsamling 2010-11 (1. samling)
NPA Alm.del Bilag 5
Offentligt
ECONOMICS ANDSECURITY217 ESCEW 10 E bisOriginal: English
NATO Parliamentary Assembly
SUB-COMMITTEE ON EAST-WEST ECONOMICCO-OPERATION AND CONVERGENCE
THE IMPACT OF THE FINANCIAL CRISIS ONCENTRAL AND EASTERN EUROPE
REPORTATTILAMESTERHAZY (HUNGARY)RAPPORTEUR
International Secretariat
13 November 2010
Assembly documents are available on its website, http://www.nato-pa.int
217 ESCEW 10 E bis
i
TABLE OF CONTENTSI.INTRODUCTION.........................................................................................................1A.II.HOW THE CRISIS SWEPT THE REGION.........................................................2
ECONOMIC CONDITIONS .........................................................................................3A.B.C.D.E.DOMESTIC ECONOMIC STRUCTURES...........................................................3INTERNATIONAL TRADE ..................................................................................5MACROECONOMIC (IM)BALANCES: CURRENT ACCOUNTS AND CAPITALFLOWS...............................................................................................................6INTERNATIONAL ECONOMIC RELATIONS .....................................................8LABOUR, MIGRATION AND REMITTANCES..................................................10
III.
IMPLICATIONS FOR FISCAL AND MONETARY POLICY .......................................11A.B.FISCAL POSITIONS BEFORE THE CRISIS ....................................................11MEASURES IN THE MIDST OF CRISIS ..........................................................13
IV.
THE LATVIAN AND BULGARIAN EXPERIENCES ..................................................15A.B.LATVIA ...........................................................................................................165BULGARIA........................................................................................................16
V.VI.
IMPACT ON MILITARY EXPENDITURE ..................................................................17RECOMMENDATIONS AND CONCLUSION..........................................................188
BIBLIOGRAPHY ................................................................................................................20
217 ESCEW 10 E bis
1
I.
INTRODUCTION1
1.Economic conditions in the 20 countries comprising Central and Eastern Europe (CEE)underwent an exceptional deterioration during the recent global financial and economic crisis.While largely spared from the initial credit-tightening that stemmed from the sub-prime mortgagemarket collapse in the United States during the first half of 2008, none of these transitioneconomies were able to avoid financial and commercial contraction following the September 2008implosion of Lehman Brothers. Indeed, the latest estimates of real gross domestic product for2009 indicate that only Albania, Belarus and Poland avoided economy-wide contractions, while theregion’s GDP as a whole shrank by 6.2% year-on-year (IMF, 2010c) These contractions occurredafter nearly a decade of economic progress which in several cases, was characterized byspectacular growth. This vertiginous reversal of fortunes quickly generated concerns about theregion’s fundamental economic vitality, raised the spectre of social unrest and has posedquestions about the future direction of political and economic reform in many of these countries(World Bank, 2010). Fortunately, by early 2010, a modicum of stability had returned to the region,although serious problems persist. Indeed, the region as a whole remains vulnerable to yetanother global downturn should such a scenario unfold.2.The late but dramatic onset of crisis in the CEE can be attributed respectively, to the crisis’sorigin in Western capital markets, as well as the region’s heavy dependence on external marketsand foreign capital. The distant epicentre of the crisis initially allowed foreign investors to keepcapital committed to CEE markets. With the exception of the Baltic States, the region enjoyedpositive returns through the first three quarters of 2008. The CEE, however, did not go unscathedduring the first phase of the crisis: from July 2007 to September 2008 credit creation and foreigncapital flows to the region, predictably, began to slow, but initially without a serious impact oneconomic growth. According to the European Bank for Reconstruction and Development (EBRD),“the main reason why these signs did not manifest themselves in declining output in mostcountries before the second half of 2008 was the continued expansion of exports” (EBRD, 2009).Quarterly data from the Economist Intelligence Unit (EIU) bears this out. Although lending rates inthe region slowed markedly during the first three quarters of 2008, exports as well as imports onlybegan to contract in the fourth quarter. Unfortunately, when the full force of the financial crisisfinally struck Central and Eastern Europe, it struck the region’s financialandreal economies in adevastating fashion as well as foreign capital and demand in tandem. Thus, from late 2008onward, “economic activity contracted rapidly, with almost no lag” (EBRD, 2009: 11).3.The financial and economic crisis has also affected Central and Eastern Europe to a greaterdegree than most other developing and emerging regions (World Bank, 2010). This is largely dueto the CEE’s unique economic structures, history and geo-political position. Indeed, theCommunist legacy of these countries puts them in a special analytical category, although with thepassage of time, that Communist legacy has become less burdensome. Following the collapse ofthe Communist bloc, the CEE countries operated below 1992 output levels for between five andten years, and in many cases their transitions were marked by sustained economic recession. Thiswas virtually inevitable as central planners had so profoundly misallocated capital and labour.Turning around decades of poor policy was inevitably going to be a painful process. By the turn ofthe century, however, the prospect of joining the European Union (EU) had both hastenedeconomic integration with advanced Western markets and served as a catalyst for criticalstructural reforms. While liberal reforms assumed different forms in each of the new EU members(Bulgaria, Czech Republic, Estonia, Hungary, Latvia, Lithuania, Poland, Romania, Slovakia and1
These are Albania, Belarus, Bosnia and Herzegovina, Bulgaria, Croatia, Czech Republic, Estonia,Hungary, Latvia, Lithuania, the former Yugoslav Republic of Macedonia*, Moldova, Montenegro,Poland, Romania, Russia, Serbia, Slovakia, Slovenia and Ukraine.* Turkey recognises the Republic of Macedonia with its constitutional name.
217 ESCEW 10 E bis
2
Slovenia), all experienced substantial growth from 2000/01 onwards as barriers to intra-regionaltrade and finance were lowered and domestic economic structures were rationalized and renderedmore internally logical and internationally competitive.4.The transition narrative for the other ten CEE countries, however, has been less consistent.In the 1990s, most of South Eastern Europe continued to operate with relatively under-developedeconomies, which were further weakened by wars linked to the break-up of Yugoslavia and all theattendant problems that violence precipitated - corruption, closed borders and commandeconomies. Yet, with the return of stability to the Balkans, the region’s governments embarkedupon substantial reforms designed to pave the way to eventual EU accession. Meanwhile, thefour Commonwealth of Independent States (CIS) countries in the CEE region – Belarus, Moldova,2Russia and Ukraine – adopted rather different approaches to economic reform and externaleconomic relations. Within the CIS, the State has assumed a much larger role in nationaleconomic life than has been the case in other CEE countries. Here the vestiges of the commandeconomy are more apparent; autonomous economic actors enjoy less space in which to operateand these markets are generally less open to global economic opportunities.5.This readily apparent diversity of economic experiences, cultures and structures has meantthat the impacts of the global economic crisis and the policy responses have varied widelythroughout the CEE.
A.
HOW THE CRISIS SWEPT THE REGION
6.It has been well documented that the initial credit crunch began in the United States’sub-prime mortgage market in the summer of 2007. As liquidity plunged and the cost of short-termborrowing surged, investors in highly leveraged positions were compelled to ‘deleverage’. They didso by withdrawing capital from higher-risk investments either to pay off other obligations or toplace it in safe havens like the US dollar or commodities markets. This generated enormous pricevolatility across a broad range of assets and financial markets. Volatility quickly spread toEuropean capital markets as many major European banks were holding assets in US securitiesmarkets. Although Western banks with a strong presence in Central and Eastern Europe withdrewcapital from the region in order to shore up their balance sheets at home, capital outflows initiallyremained relatively minor through the first half of 2008. The Baltic States, however, wereexceptions in this regard. Their stellar growth rates had been largely financed by large inflows offoreign capital, which generated a financial bubble that had already begun to deflate by late 2007.In any case, with the collapse of several major US firms in September 2008 (Lehman Brothers,AIG and Bank of America) the initial credit crunch turned into a full-blown global financial andeconomic crisis throughout much of the region.7.As financial markets around the world roiled with uncertainty during Q4 2008, the CEEregion underwent a so-called ‘sudden stop’ of bank lending (EBRD, 2009). To make mattersworse, this occurred as import demand in the West struck production schedules for CEE goods.The scarcity of existing capital and rising risk premia for new capital had also triggered a sharprise in borrowing costs for the region’s governments and private sector. From 2007 to 2009 netinvestment in the CEE declined precipitously from a record US$255 billion to roughly US$20 billion3– a drop of over 90% (UNECE, 2010). Goods and services exports declined rapidly in late 2008and early 2009. The UNECE (United Nations Economic Commission for Europe) reports that theCEE region’s value of exports contracted by 27.5% in 2009, while the total value of regionalimports declined by an even greater 30% (UNECE, 2010).2
3
Ukraine is technically not a member of the CIS, as the Ukrainian Parliament has not ratified the CISTreaty. However, it participates as ade factofull member.These data are for the 17 reporting countries in the CEE. Up-to-date data was not available for theformer Yugoslav Republic of Macedonia, Montenegro and Serbia.
217 ESCEW 10 E bis
3
8.In a region highly dependent on foreign markets, it did not take long for these contractions totranslate into severe hardship. Unemployment soared with job losses greatest in the highervalue-added sectors. For the 15 countries with available statistics, the unweighted average ofofficial unemployment rose from 9.5% to 12.6% from the first quarter (Q1) of 2009 to Q1 2010(EIU, 2010). These numbers, however, masked important regional differences. For example, thethree Baltic States saw their unemployment rates more than double from 6.3% in 2008 to 16.8% inQ1 2010 (unweighted average). While there are now signs of recovery throughout the CEEregion, unemployment has increased across the region, a development which generates bothfiscal and political tensions.9.It is important to note where these job losses occurred. Across the region industrialproduction and construction fell faster than any other sector and, accordingly, these sectors haveshed the greatest number of workers. While this follows logically from tightening export marketsand credit availability, it means many skilled workers were among the most severely affected bythe crisis.10. Indeed, the economic fallout leapt almost seamlessly from financial to export markets toindustrial production. Eventually no sector of the labour market was spared. National governmentsscrambled to cope with the crisis and to reignite the economic dynamism that defined the regionover the past decade. Some began to correct the deficiencies that had left them so vulnerable inthe recent global downturn. The optimal policy responses throughout the European continent andin North America, however, were not always obvious and remain the subject of some dispute. Onthe one hand, the collapse in private consumption and investment has fuelled calls forKeynesian-style fiscal expansion to fill the gap in aggregate demand. On the other hand, soaringdebts have pointed to the need for fiscal austerity in order to reinvigorate the supply side ofnational economies, bolster foreign investor confidence, and to put national budgets on asustainable foundation. In fact, a mix of these policy goals has generally been adopted. The policyresponses have been strongly conditioned by the particular economic frameworks in place asthese countries entered the crisis and by the fiscal resources that were available to nationalgovernments at the onset of the crisis.
II.A.
ECONOMIC CONDITIONSDOMESTIC ECONOMIC STRUCTURES
11. Over the past two decades various Central and Eastern European countries have variouslyundergone ‘shock therapy’ reforms, backlashes against liberalisation, war and strife in theBalkans, political and economic integration with the EU, WTO and NATO, the introduction of ortightening links to the euro, revivals of State control, and ‘colour revolutions’. No two nationalexperiences have been identical and the past two decades have perhaps only exacerbated theheterogeneity in the CEE. It was inevitable that the global crisis would strike countries operating insuch variegated landscapes in very different ways. It was also inevitable that the policy responsesto that crisis would diverge markedly.12. While the entire region has suffered as a result of the financial crisis and the precipitousdecline in foreign demand, the Baltic States, Ukraine, Moldova and Russia underwent the steepestcontractions in real GDP in 2009, ranging from a 7.9% decline in Russia to a staggering 18.0% fallin Latvia. At the other end of the spectrum, Poland and Albania avoided contractions, growing by1.8 and 3.0% respectively, while the Belarusian economy remained almost stagnant with a realincrease of 0.2% (EIU, 2010). Interestingly, the capacity of these economies to weather thefinancial storm hardly correlates with the EBRD’s transition scores - a rating system designed to
217 ESCEW 10 E bis
4
gage the overall degree of transition toward free-market liberal systems. The three Baltic States,for example, fare quite well in each transition category with average scores ranging from 3.7 to3.93 of a possible 4; Poland received a lower score of 3.78. These measures of economic4modernisation and policy liberalisation are second only to Hungary (3.96) and Slovakia (3.78). Incontrast, Albania, Moldova, Russia and Ukraine score at or slightly above the 3-point mark (from53.0 to 3.07). These disparities roughly correlate with the 2009 rankings of political liberalisationthat are published annually by Freedom House as well as the Heritage Foundation’s economicfreedom rankings. At first glance, variation in these countries’ respective capacities to weather thefinancial and economic crisis does not seem to relate to the degree of market liberalization.13. Moreover, while a large and diverse internal market generally seems to bolster resilience(IMF, 2009c), this alone seems insufficient to galvanise recovery. Although the Russian economyis over three times the size of Poland’s, Russia’s seemingly inexorable embrace of ever greaterState intervention and persistently poor relations with foreign investors has characterised nationaleconomic policymaking in recent years. In 2009 the Russian economy shrank by 7.9% (EIU,2010). Poland, which has a relatively large internal market although hardly the size of Russia,performed the best in the EU over the initial 18 months of the crisis. Its macro- and micro-economic policies seem to be a critical part of the explanation. The relative wealth of a society(measured by GDP per capita) also appears to bear only a minor relation to resilience in the faceof crisis. While Ukraine and Albania’s average incomes are the second and third lowest in theregion (approximately US$7,000), Albania had the highest growth on the continent, while Ukraine’sranked second worse, with a drop of 15.3% in 2009.14. The relative starting positions of these economies are also of some import. Standard growththeory asserts that,ceteris paribus,economies with lower levels of capital and income per workerwill grow more quickly than more advanced economies when capital is suddenly made available,until all economies reach their ‘steady state rate of growth’ (Solow, 1956). In the CEE this‘catch-up’ effect can be observed in Albania, which started at a significantly lower level of GDP percapita than its neighbours, but not in Moldova where the average income level was comparable toAlbania’s in 1992 but which has subsequently lagged behind (IMF, 2009a). In terms of cumulativeGDP growth since 2003, IMF projections for 2010-2014 suggest that relatively poorer countries inthe 1990s, such as Ukraine, Moldova and Russia, will outperform Poland. While Albanian growthwill trail that of Poland, it is set to achieve cumulative growth in 2010 higher than that of Estonia,Latvia and Lithuania - countries where average income has grown rapidly over the past decade.Surprisingly, the situation was not so different before the crisis. In 2007 and 2008 Poland andAlbania grew at their lowest pace since 2003, and the Baltic States were outperformed by Ukraine,Moldova and Russia. Looking at cumulative growth since 1993, however, paints a different picturewith Ukraine and Moldova growing the least in the CEE, while the fastest growing economy up to2008 was Albania, followed by Estonia and Latvia, which only enjoyed average levels of GDP percapita throughout the 1990s. All of this suggests that some of Europe’s poorer countries havegrown more rapidly, and that some of this growth, for example, in Albania seem to be linked toprogressive institutional reforms (SET, 2010) rather than a simple ‘catch-up’ mechanism. In otherwords, government policies and institutions matter.15. In the final analysis the degree of liberalisation, economic size and the ‘catch-up effect’ oflower initial per capita income do not fully explain the region’s diverse growth patterns and thedifferentiated impacts of the crisis. These structural factors certainly play an important role insetting the context for successful economic performance, but clearly the specific context in each4
5
The Czech Republic is even more modernised according to the EBRD’s assessment, as it has ceasedproviding development assistance as of 2009. Therefore, the country is no longer part of the TransitionReport.Only Belarus (2.04), Bosnia and Herzegovina (2.78), Montenegro (2.85) and Serbia (2.89) rank lowerthan these three extreme cases.
217 ESCEW 10 E bis
5
country is quite varied. This report will now discuss these different contexts and, in so doing, willhighlight elements that have shaped the contours of a crisis that has severely undercut Centraland Eastern European growth.
B.
INTERNATIONAL TRADE
16. A common feature of the CEE region is its dependence on external markets for domesticgrowth and prosperity. Trade with Western Europe and Russia is crucial for all CEE economies.Important differences emerge, however, with respect to their dependence on foreign finance. Thedizzying influx of foreign capital to the region in the years before the crisis ultimately generatedlarge macroeconomic imbalances. These capital inflows not only underwrote new and essentialinvestment but also funded a consumption boom and current account deficits that were, in manycases, unsustainable (EBRD, 2009). While the countries with more open financial structuresposted impressive growth rates in the early 2000s (i.e., the Baltic States), these were also theeconomies hardest hit by the precipitous retrenchment of foreign capital and credit. For thoseStates operating in closed or tightly restricted capital markets, the crisis was transmitted throughthe contraction of export markets, while reduced financial inflows had a relatively smaller impact.17. In the eight years before the crisis, the CEE had posted exceptional rates of growth,especially when compared to their relatively dismal economic performance in the 1990s. RealGDP growth rates of 6 to 10% were common across the region in the middle part of this decade(IMF, 2010c). Increasing industrial output propelled much of this growth, particularly in thosecountries with the most ‘catching-up’ to do, including Albania, Belarus, Bulgaria, Latvia, Lithuaniaand Ukraine. During this same period exports expanded even more quickly and consistently thanindustrial production, with only Ukrainian exports undergoing real declines prior to the crisis6(EBRD, 2009). This growth was obviously welcomed and generally seen as a sign of the region’sincreasing modernisation and resilience.18. In the years following the 1998 Russian crisis, some 50 million people moved out of povertyin Eastern and Central Europe, the former Soviet Union and Turkey. This was driven by risingincomes and particularly increasing real wages among the working poor. The recent crisis,however, has put these gains at risk. According to a recent World Bank Study, in 2010 there willbe 11 million more people in poverty in the region and another 23 million people living just abovethe international poverty line relative to pre-crisis projections (Sugawara et. al.). In other words,roughly one fifth of those who recently escaped poverty will have returned to it. Countries wherehouseholds have been overly dependent on the construction sector and remittances will suffer themost. Secondary effects on social safety nets and education could have even longer-term effects.19. The expansion of exports, by definition, increased the region’s reliance on external markets,especially with regard to Western European markets. From 2006 until 2008 a majority of the CEEcountries were exporting of goods and services at a level equivalent to more than half of theirGDP, revealing a remarkable degree of openness. Indeed, the CEE is significantly moredependent on external markets than other emerging market regions. (Darvas and Veugelers,2009) The Czech and Slovak Republics, Estonia and Hungary led the region in exportdependence, with each posting gross export values equivalent to approximately 80% of GDP.These four cases also demonstrate the downside risks of export dependence (at least in arecessionary world), as the Czech and Slovakian economies contracted by over 4% in 2009despite strong fundamentals. Hungary’s weaker fiscal position and Estonia’s credit-fuelled growth,by contrast, exacerbated their steep declines. As discussed above, a significant domestic marketcan be most helpful when international markets are deteriorating. For example, although Albania6
The EBRD does not report this information for all countries. Omitted are Belarus, Bosnia andHerzegovina, the Czech Republic, the former Yugoslav Republic of Macedonia, Montenegro andSerbia.
217 ESCEW 10 E bis
6
does not have a large internal market, it is less open to trade and finance than other transitioncountries. Unlike the rest of the region, it maintained an admirable growth rate in 2009. Obviously,interdependence can sometimes generate additional losses during downturns, but this hardlyjustifies even temporary protectionist measures. Over the long run, openness brings a welter ofeconomic benefits and should continue to be encouraged.20. While most of the CEE economies have seen exports rise as a share of GDP, one group, ledby Russia, has had quite a different experience. Despite the strong growth of the Russianeconomy from 2000 to 2008, gross exports of goods and services declined over this period from44 to 31% of GDP-equivalence. Only Belarus, Moldova and Ukraine have experienced similardeclines in the export share of GDP since 2000 – all of which are members of the CIS(Commonwealth of Independent States). These countries are all relatively distant from Westernmarkets, have some common institutional structures and political norms, and are less advanced intheir transition toward liberal market structures and open societies. These factors tend to reinforceexisting trade and policy patterns within the CIS. The CIS’s greater dependence on volatileprimary resource exports is also a factor as this tends to discourage the kind of productdiversification that might deepen their trading positions.Moreover commodity crisis fellsubstantially during the crisis. Yet, for all their similarities, these economies have reacted indifferent ways to the global crisis. Ukraine, for example, contracted by 15.2% against declines of7.9% in Russia, 6.5% in Moldova, and a 0.2% increase in Belarus (UNECE, 2010). In terms of netexports, Moldova suffered trade deficits of over 50% of GDP in 2007-08 (by far the largest in theCEE); Belarus had smaller trade deficits approaching 5%; Ukraine’s trade was balanced over the2000-08 period, while Russia enjoyed consistently large trade surpluses stemming from its role asa major energy supplier.Thus, even within this sub-group sharing several importantcharacteristics, major differences are evident.
C.
MACROECONOMIC (IM)BALANCES: CURRENT ACCOUNTS AND CAPITALFLOWS
21. The high volume of Central and Eastern European exports has been a critical factor in theregion’s impressive growth over the past decade. The pattern of rapid, trade-driven growthfollowed by a crash in many ways mirrors the East Asian experience during the 1990s (BIS, 2009).Yet, the CEE is distinct insofar as many of these countries have experienced unprecedented levelsof current account deficits largely due to the ubiquity of finance-led growth patterns. This was notthe case in Asia (EBRD, 2009). Although current account deficits often reflect developingeconomies’ requirements for imported capital and capital goods, sustained and rising currentaccount deficits can undermine macroeconomic stability when failing to bolster productivity growth(IMF, 2009d). They also put downward pressure on currencies and, if the exchange rate is notallowed to depreciate, can potentially generate fundamental internal disequilibria. On the otherhand, depreciation can push up inflation and increase the cost of debt denominated in foreigncurrencies; it is precisely for that reason that governments sometimes resist depreciation despitethe potentially positive effect it can have on the trade balance (IMF, 2009d). When maintaining afixed exchange rate, however, there is no choice but to adjust internally which can mean real wagecuts, increasing unemployment and reduced consumption. In retrospect, the vulnerability thatdeepened the crisis in the CEE is not surprising given that the average regional current accountdeficit was 5% of GDP (10% if one excludes Russia) for several years before the crisis.22. The Asian financial crisis of 1997-98 revealed that even when coupled with strong growth,large and sustained current account deficits leave economies vulnerable to swift reversals ofcapital inflows, which directly impinge on both growth and investor confidence (BIS; IMF, 2009d).Likewise, significant current account deficits stemming from large capital inflows were crucialfactors in the early and precipitous contractions in Estonia, Latvia and Lithuania, as most foreignfinance fled at the first signs of uncertainty (World Bank, 2010). Current account deficits in theBaltic region were among Europe’s largest and most unsustainable. At their peak in 2007, the
217 ESCEW 10 E bis
7
Estonian, Latvian and Lithuanian current account deficits stood at 17.8, 22.3 and 14.6% of GDP,respectively; two years later, these deficits had been completely reversed, and the three BalticStates had become the only current account surplus countries apart from Russia and Hungary inthe CEE (IMF, 2010c).23. Current account deficits, however, only partially account for the region’s economicvulnerability. Russia’s large surpluses, for example, did little to stem its contraction of 7.9% in2009. Moreover, while in 2008 Bulgaria and Montenegro posted the region’s largest currentaccount deficits of 24 and 52% respectively, in 2009 their economies declined by 5.0 and 3.1%,relatively modest contractions compared to the Baltic States (IMF, 2010c).24. These narratives reveal significant differences between the boom and bust cycles in Centraland Eastern Europe this decade and what transpired in East Asia eleven years prior. First, therecent current account deficits and economic contractions in the CEE are much greater than thoseobserved in East Asia in 1997-98 (EBRD, 2009). Secondly, unlike East Asia in the 1990s, theCEE has been a net importer of goods and services this decade. While the Czech Republic,Hungary, Slovenia and Ukraine shifted from net exporter to net importer positions, Russia held theonly consistent net trade surplus position from 2000 to 2008. For the remainder, net importsranged from below 5% of GDP (Belarus, Poland, Slovakia) to around 20% (Albania, Bulgaria, theformer Yugoslav Republic of Macedonia, Latvia, Serbia) and to over 40 and 50% of GDP in themost extreme cases (Bosnia and Herzegovina, and Moldova). Again excluding Russia from thecalculation, the CEE saw aggregate net exports fall from -4.97% of GDP in 2006 to -5.76% in2007, finally reaching its nadir in 2008 with net exports accounting for -6.25% of GDP (UNECE,2010). Clearly the economic success of the CEE was not simply rooted in export growth, domesticreform, finance driven growth and domestic consumption have also been key factors here (IMF,2006).25. Over the past decade, gross capital inflows to most emerging market economies (EMEs)increased rapidly. In a recent study of the potential sources of financial instability, the Bank forInternational Settlements reported that gross inflows into East Asia reached 15% in 2007,5 percentage points higher than the pre-1997-98 peak, whereas the CEE region enjoyed grosscapital inflows of over 20% of GDP. Spurred by closer integration with the European Union, thesehuge inflows were largely intermediated by foreign-owned banks, which reduced solvency riskswhile increasing credit risks (BIS, 2009). In other words, foreign banks’ large capital basesensured that subsidiaries had access to affordable capital, but the decision-makers’ distance fromlocal market conditions and lending practices weakened their oversight capabilities. Credit riskproved an important factor in the rapid collapse of Central and Eastern Europe, as demonstratedby the steady increase in the proportion of non-performing loans (World Bank, 2010). Althoughdelayed payments and defaults are to be expected in downturns, the data on CEE arrearsdemonstrates patterns symptomatic of a more acute problem (EBRD, 2009; BIS, 2009; WorldBank, 2010).26. In sustainable growth patterns consumption trends are smoother than the more volatiletrends in income growth. This, however, was not the case during the CEE’s boom years. From2003 until 2008, only the economies of Bulgaria, Croatia, Hungary, Poland, the Slovak Republicand Slovenia grew more quickly than the rate of private consumption growth. In the otherten economies with available data, people consumed increasingly more than they earned – a trendmade possible through consumers’ ever-easier access to credit - oftentimes denominated inforeign currencies. Through the current crisis, these six countries generally performed better thanEstonia, Latvia, Lithuania, Moldova, Romania, Russia and Ukraine, all of which underwent asignificantly higher expansion of private consumption over GDP. Moreover, much of the credit tohouseholds and to businesses was euro-denominated, considerably increasing credit risks linkedto exchange rate movements (World Bank, 2010). Unsurprisingly, exposure levels tended to begreater in countries with a larger foreign-bank presence.
217 ESCEW 10 E bis
8
27. This phenomenon was particularly evident in the Baltic States, Moldova and Romania.Consumption in Albania and Belarus expanded more quickly than GDP, but these countriessuffered comparatively less than the Baltic States, Moldova, Romania, Russia and Ukraine whereconsumption rates increased at an even quicker pace. One explanation for this is that, for variousreasons, Albania and Belarus are more insulated from international capital markets (EBRD, 2009).Russia and Ukraine represent another exception as both had generated large current accountsurpluses prior to the crisis, but this offered insufficient protection in the face of unsustainablyrising private consumption (particularly for Ukraine where private consumption grew annually byroughly 10 percentage points more than did GDP). In sum, while much of the inflowing foreigncapital was destined for fixed capital formation (the fastest growing component of investmentacross the region), those countries that indulged in unsustainable rates of private consumptiongrowth were particularly vulnerable when the global economy turned downward.28. As a final note, the IMF recently highlighted the fact that certain Foreign Direct Investment(FDI) (i.e., those between parent banks and their subsidiaries) flows are far more volatile thanpreviously thought. Such capital flows conform to patterns more akin to short-term debt than tolong-term investments (IMF, 2010). While fixed capital investments were comparatively morestable, remittances appear to have contracted the least.
D.
INTERNATIONAL ECONOMIC RELATIONS
29. The remarkable growth in the CEE over the past decade was also driven by the region’smounting integration with international institutions, and with the European Union in particular.Some of the countries that have acceded to the EU since 2004, however, have faced seriousinstitutional problems. In some cases there were difficulties in properly employing available EUstructural and cohesion funds. But with strong support and encouragement from the EuropeanCommission (EC) and with capable domestic leadership, the absorption capacity of theseeconomies increased markedly from 2007 onwards (Euractiv, 2008). These funds combined withfundamental institutional reforms, which were an essential element of the accession process,enabled growth and stability in the region (Schnabl, 2009). Membership in liberal inter-governmental organisations and even associate status with them has been a primary catalyst forpro-growth reform. Currently, Bosnia and Herzegovina, Croatia, the former Yugoslav Republic ofMacedonia, Montenegro and Serbia have each signed and are implementing EU Stabilisation andAssociation Agreements, which have driven economic reforms in a manner to encourageinstitutional and policy convergence.30. The Commonwealth of Independent States plays a similar role in trying to unify regionalpolicies, although liberal reform has hardly been a top priority for that body. Led by Russia, thispolitical and economic group also engages Belarus and Moldova along with Ukraine, which hasnot ratified the CIS Treaty but which participates as a full member. Despite attempts to strengthenthe CIS, it has yet to establish inter-governmental institutions with clear policy goals that supportthe members in times of need. Its orientation, moreover, is not nearly as liberal as that of the EUor other regional institutions like ASEAN (Association of Southeast Asian Nations) or NAFTA(North American Free Trade Agreement), nor does the CIS have established legal relationsregulating the convergence of policies.31. Most CEE countries are also members of the IMF and the WTO. WTO membership hasprovided a crucial economic advantage to it newer European members, as it has both advanceddomestic reforms needed to bolster international competitiveness and helped open markets forthese countries’ exports. Indeed, the accession of Estonia and Latvia in 1999, and Lithuania in2001, was an important factor in the Baltic export boom of the past decade. Bosnia andHerzegovina, Montenegro and Serbia have all been working hard to join the WTO, and each isnow approaching the final stages of accession talks (WTO, 2010). In contrast, Russia, Belarus,
217 ESCEW 10 E bis
9
Bosnia and Herzegovina, Montenegro and Serbia are continuing in the accession processes.While there had been conflicting signals regarding Russia’s drive for membership, PresidentMedvedev had appeared to win the internal struggle over whether Russia ought to join theorganisation sooner rather than latter (FT, 2009). President Obama endorsed this goal at aUS-Russian summit in June 2010 and vowed to make progress on the outstanding technicalissues that the US government believes need to be resolved before Russia can be admitted.(Kaufman) However, the outcome of Russia’s entry to the WTO remains uncertain given PrimeMinister Putin’s continued commitment to protectionist measures, most recently in the automotiveindustry (FT, 2010d). The apparent difference between Russia’s two leaders in this regard isrevealing.32. Participation in IMF programs has also helped vulnerable CEE countries to weather thedownturn. The IMF has been instrumental in supporting the economies that were in free fall at theheight of the financial crisis through the disbursement of loans necessary to cover current accountdeficits and to restore international investor confidence. The IMF granted emergency assistanceto Belarus, Bosnia and Herzegovina, Hungary, Latvia, Poland, Romania, Serbia and Ukraine.With the exception of Poland, each country was extended a Stand-By Agreement (SBA), whichhas long been the central lending facility of the IMF. Stand-By Agreements are designed to helprecipient countries address macroeconomic imbalances and, in particular, large current accountdeficits. The loans, however, are disbursed in tranches, with each new issuance released if andonly if the recipient country reforms its fiscal and macroeconomic policies in accordance with theconditions established in the agreement.33. This ‘conditionality’ incentivizes governments to take what are often unpopular decisions,which are nonetheless needed to restore economic stability. In Latvia, both emergency assistanceand fiscal consolidation were inescapable. The SBA funded by the IMF, the EU and Scandinaviangovernments imposed requirements for tax hikes and wage cuts to curb a runaway budget deficit(FT, 2010a). The programme has proven a tempting target for the opposition parties appealing topopular resentment. However, when tough austerity measures become the criteria for bailouts,the pressure on governments is somewhat eased. In some cases, however, the IMF can becomethe target of government wrath as has occurred in Hungary, where the current government has puta halt to bail-out loan talks after the IMF claimed Hungary was not acting with sufficient alacrity tomake durable cuts in State spending. (Fairclough) In Ukraine, the Stand-By Agreementproceeded on course from November 2008 until the presidential electoral campaign inspired aseries of populist spending measures. Following the establishment of the new government, theIMF formally approved a new Stand-By Agreement on 28 July 2010 worth US$15.2 billion over twoand a half years (EIU Country Report, 2010). Although IMF conditionality has long been acontentious issue, there is little doubt that the quick delivery of emergency funds was fundamentalin keeping, for example, the Latvian currency peg from breaking and in covering Ukraine’s foreignloan payments – two outcomes that would have seriously exacerbated the social and economicfallout of the financial crisis. The IMF has thus helped to ensure policy stability in the regionthrough its role as the lender of last resort, while both the WTO and the EU have provided alonger-term context for advancing macro- and micro-economic reforms.34. Poland’s recent dialogue with the IMF has differed from those conducted by its neighbours.Like Ukraine, Poland’s exchange rate was allowed to float freely, but the government has pursuedsound macroeconomic policies and strong regulatory oversight. Its current account deficit stood ata manageable 5% of GDP in 2008 (IMF, 2009e). Currency depreciation endowed it with a degreeof flexibility that fixed-exchange rate regimes did not enjoy (i.e. the Baltic States, Bulgaria andeurozone members). Poland also qualified for the IMF’s new ‘Flexible Credit Line’ (FCL) facility - apre-emptive and optional loan that aims to restore confidence in the recipient’s economy(IMF, 2009f). Remarkably, Poland did not draw on the Special Drawing Rights SDR13.69 billionavailable before the contract expired in May 2010. Poland and the IMF have now rolled-over the
217 ESCEW 10 E bis
10
loan for another year (until July 2011), but it seems unlikely that Poland will need to access theseemergency funds.
E.
LABOUR, MIGRATION AND REMITTANCES
35. The social impact of the global crisis, of course, has been enormous. Falling real wages andrising unemployment have placed enormous burdens on both the people of the region and nationalinstitutions. The shock has curbed what were often unsustainable levels of consumption, butthose suffering job losses as a result are among the greatest victims of the crisis. In addition tojob losses, remittances coming into poorer countries and poorer communities have declined as thelabour markets in host countries have also tightened. Thus, with worsening prospects at homeand abroad, many potential migrants are staying at home, while some of the diaspora return homelooking for work in their communities. Unfortunately data on migration flows during the crisisremain imprecise. There are nevertheless signs that migration from the region decelerated or, insome cases, may have reversed. All of these factors have increased demands for governmentsocial support. Yet, government finances have deteriorated to such an extent that, in many cases,social services have not been able to keep pace with the rising demand for them. While there islittle evidence of a broad ideological shift against liberal capitalism either in the public or in nationalpolitical parties, mounting public anger cannot be discounted, and this could set back reformprocesses (World Bank, 2010). High unemployment could also increase criminal activity, whichobviously has high social and economic costs.36. Job losses in part of Central and Eastern Europe have already reached unprecedented7levels. Based on the EIU’s estimates for 14 of the CEE countries, the number of officiallyunemployed persons increased from about 9.33 million in 2008 to 12.05 million in 2009 – a 30%jump in one year. The largest increases have been in the Baltic States. In 2007, theunemployment rates were, respectively, 4.7, 6.0 and 4.3% in Estonia, Latvia and Lithuania; thesefigures for Q12010 reached 14.4, 20.4 and 15.6% – a three-fold increase in people actively lookingfor work (EIU, 2010).Quarterly data from the Economist Intelligence Unit shows thatunemployment rates in the CEE rose in each quarter in 2009 and have continued upward in thefirst two quarters of 2010. A recent World Bank study (Arvo Kuddo) suggested that from 2008 to2009 the official unemployment rate would skyrocket in the Czech Republic, Slovakia, Ukraine (anincrease of > 30%), Russia (> 40%) and Moldova (> 60%). While the rest of the region faredslightly better, there is clearly a risk that part of this rise in joblessness may become structuralrather than cyclical, which will place greater long-term burdens on CEE governments andsocieties. The young working population and marginal groups, such as minorities andimmigrations, have been hit hardest (Kuddo, 2009), a factor which could also increase the risk ofsocial unrest in Central and Eastern Europe.37. Unemployment surveys cover only those persons who are registered as actively looking forwork. They exclude those who have given up the search or who have never registered. To betterfathom changes in the job market, therefore, it is useful to also look at total employment figures.In the 11 countries with available data (the EU members plus Croatia), total employment fell inevery country at the beginning of 2009. While employment levels began to increase as Westernstimulus measures kicked in the second and third quarters of 2009, the sluggish growth of exportmarkets and the launching of fiscal consolidation measures led to decreases in total employmentin Q4 2009 and Q12010 (Eurostat).38. While these absolute declines are stark, of even greater concern are the sector-specificdeclines. Sectoral data for the CEE EU members reveals that the manufacturing sector has beenthe hardest hit. Despite the slight rebound in total employment in mid-2009, employment in7
Excluding Albania, Belarus, Bosnia and Herzegovina, the former Yugoslav Republic of Macedonia,Moldova and Montenegro.
217 ESCEW 10 E bis
11
manufacturing has been declining in every country in almost every quarter: from Q1 2009 toQ1 2010, Czech Republic, Estonia, Latvia, Hungary, Slovenia and Croatia each had one quarter inwhich manufacturing employment increased – all other quarters showed reductions in the numberof employed people. In aggregate, this amounts to 705,000 fewer manufacturing jobs in Q12010compared with the beginning of 2009 – or a loss of 1.8 million manufacturing jobs since Q12008.As the manufacturing sector in these countries accounts for a greater share of employment thanany other sector, it is a critical generator of wealth for the CEE countries and its workers(Eurostat).39. Adding to the social and economic consequences of greater unemployment and reducedwages are, respectively, the reversal of migration flows and declining remittances, which are aparticularly important source of foreign exchange earnings in a number of CEE countries. Withfewer people moving to the advanced economies (particularly to Western Europe) and withincreasing numbers returning to the CEE, competition for jobs and for social support has been asource of some social, political and economic tensions.40. Remittance flows to Central and Eastern European countries declined from their 2008 peakof US$57.2 billion to US$46.7 billion in 2009 – a drop of 18.3% (World Bank, 2010). This is asignificant reversal given the 20 to 30% year-on-year growth of remittance inflows during thepreceding decade. While this is indeed a heavy loss for many people in Central and EasternEurope, the 2009 remittance receipts are still significantly higher than the US$38.8 billion receivedin 2006. In Serbia, Albania, Moldova and Bosnia and Herzegovina, remittances are economicallycrucial as they account for over 10% of GDP in each country. It is important to note thatremittances tend to flow to the lower echelons of society and thus provide an important degree ofsocial support, even when not accounting for a large share of a given national economy. Forexample, in 2008 inflowing remittances generated a mere 0.4% of Russia’s GDP (the lowest in theregion), but this provided an extra US$6 billion in household income.
III.
IMPLICATIONS FOR FISCAL AND MONETARY POLICY
41. For obvious reasons the condition of public sector finances has deteriorated during thecrisis. Across the board, CEE governments have recorded their largest deficits in years. In severalcases these represented the largest deficits since the initiation of transition. They are not uniquein this as most Western governments are also experiencing very serious fiscal pressures arisingout of the global crisis, falling revenues and rising outlays linked to automatic stabilisers andstimulus packages. In aggregate, the CEE’s deficit level rose from -1.8% of GDP in 2008 to -5.3%in 2009. This is particularly worrisome as the region’s real GDP declined by approximately 6.2%.Increasing expenditure is largely due to the onset of ‘automatic stabilisers’ includingunemployment benefits and social services that kick in as an economy turns downward. AlthoughCEE countries have engaged in some discretionary spending to bolster demand, suchcounter-cyclical efforts are limited by thin reserves and borrowing limits which reduce the fiscalspace for maneuver.
A.
FISCAL POSITIONS BEFORE THE CRISIS
42. A central question all governments in Europe and North America must address today is: whatgovernment policies can most quickly put national economies on a sustainable growth path? Ofcourse, there are no easy answers to this question. Rapid and sustainable growth depends on amultitude of factors, many of which are non-economic. These include institutional histories, socialcleavages and political cultures. Some serious faults have been identified in certain governmentpolicies during the ‘good times’ (IMF, 2010a), and there are discussions about which particularpolicies would have been more appropriate at particular points throughout the business cycle(Lewis, 2009). Indeed, the unprecedented nature of the financial and economic crisis has triggered
217 ESCEW 10 E bis
12
a renewed appraisal of the foundation of macroeconomic policies which, among other things, hasresurrected Keynesian approaches (IMF, 2009d; BIS, 2009). Many analysts, including those fromthe IMF, now agree that fiscal policy should have, and could have, been tighter during the boomyears. Had greater prudence been exercised, governments would have had more fiscal space tocombat the economic and social consequences of the crisis as it broke. Of course, this is alsotrue for a number of Western countries burdened with sustained fiscal deficit problems, but theirability to borrow internationally provides some fiscal flexibility that transition countries simply do notenjoy.43. Some critics (e.g. Darvas, 2009) have blamed many CEE governments and others in theOECD for pursuing pro-cyclical fiscal policies – that is, for over-zealously expanding governmentspending during periods of growth – which subsequently limited their capacity to engage indiscretionary spending when it was truly needed during the downturn. However, a recent study8by John Lewis (2009) tests the cyclicality of CEE governments’ fiscal policies with real time data.Lewis’s empirical testing demonstrates that “the total response of fiscal policy is roughly the samesize as external estimates of automatic stabilisers”, which suggests that the stance of discretionarypolicy is, on the whole, acyclical (Lewis, 2009). Regardless of these spendingtrends,budgetdeficits were common during the boom years and, as a result, many governments squandered anopportunity to build up stronger financial positions during the boom.44. Interestingly, most CEE governments fared better in this area than the EU-27 average. EUmember States are obliged to keep government finances in line with the Stability and Growth Pact(SGP) criteria, in which deficits are to remain below 3% of GDP and total government debt is to beno higher than 60% of GDP. Only Bulgaria, Estonia (up to 2008), and Russia ran consistentbudget surpluses during the five years leading up to the crisis (EBRD, EIU). The stories behindthese surpluses, however, vary considerably. Impressive structural reforms in Estonia andBulgaria, for example, reinforced their austere fiscal posture – policies that are essential tosustainability in small States with open economies and tightly pegged currencies (see below).Russia’s budgetary surpluses were, by and large, the product of the high oil and gas prices, whichaccount for a significant proportion of Russian exports and government revenues. Bosnia andHerzegovina also ran budgetary surpluses up to 2006. However, this position began to weakenduring the political stalemate following the parliamentary elections in Bosnia’s entityRepublika Srpska held in October 2006. Bosnia and Herzegovina’s finances rapidly deterioratedin 2007 and 2008 perhaps because the weakened influence of the EU’s High Representativeremoved an “external” source of fiscal discipline in that divided country. While perhaps anextreme example, Bosnia’s recent history demonstrates how expedient policymaking cannegatively affect a State’s long-term economic stability in a very short amount of time.45. The remaining 16 CEE countries ran deficits as well and the bulk of these were above the-3% floor. As discussed in the previous section, the attraction of EU membership provides positiveincentives for economic reforms, yet these seem to wane once membership is secured. Indeed,although several CEE government budgets relaxed in recent years, this is not associated withentry into the EU but appears to begin once entry is ‘in the bag’ (Lewis, 2009). Similarly, this wasshown to be the case for the Czech Republic, Poland and Hungary in the years prior to NATOaccession (Berger et al., 2007). However, the deficits of the Czech and Slovak Republics weresignificantly reduced in 2007 and 2008, which somewhat eased the budgetary burden during thecrisis. In contrast, since 2003 Albania, Poland and Hungary each ran deficits well in excess of the-3% benchmark (EBRD, 2009; EIU). Since 2006, Hungary has had a general government debtexceeding 60% of GDP. For Belarus, Moldova, and Ukraine – where the desire to join the EU isless clear – government finances have been conditioned somewhat by financing and reform
8
That is, data that was actually available at the time of budget making, rather than the more accuraterevisions that are generally used in econometric studies.
217 ESCEW 10 E bis
13
agreements with the IMF, with only Ukraine running consistent, albeit modest, deficits prior to thecrisis.46. By comparison, in 2008 the EU-27 average government deficits stood at -2.3% of GDP,while the average debt load was 63.2% (equivalent figures were slightly worse for the euro-zone).The latest data shows that the unweighted average of balances for EU members in the CEE was9-2.5% in 2008 and only -0.7% for the non-EU members. More impressive is the region’s averagedebt level, which stands at a mere 26.5%, with only Albania (55.9%) and Hungary (72.6%) assignificant outliers. On the whole, CEE government deficits before the crisis (including non-EUmembers) were lower than those of the advanced economies of Europe, North America andJapan. Indeed, several of the EU’s southern members generated particularly high levels of debt inthe run up to the crisis, in part, because their position in the eurozone significantly reduced interestspreads, and this encouraged significant capital inflows. These inflows proved unsustainable oncethe crisis struck. As these governments lack the flexibility to devalue their currencies to kick startgrowth, they are compelled to choose between painful domestic austerity or the high-risk option of(partial) default. To date the former solution has been chosen and Europe has scrambled to makethe second option untenable.47. A similar dynamic is also apparent among some eurozone aspirants although they,theoretically, are in a position to devalue their currencies before joining. However, this course hasbeen avoided in the Baltic countries and in Bulgaria in favour of the long-term stability thateurozone membership should bring (Soros). In several countries very tight austerity measureshave recently been introduced to address fiscal shortfalls as quickly and stringently as possible.Indeed, the discretionary fiscal space available to the CEE is much reduced because their accessto foreign finance is now significantly restricted. The unfortunate lesson is that despite high levelsof growth, stability, and the myriad benefits of NATO and EU membership, the CEE governmentswill likely remain more fiscally austere than advanced economies as they face a greater need toassuage market foreign investors’ perceptions of default risk.
B.
MEASURES IN THE MIDST OF CRISIS
48. During 2009 most of the region’s governments, save Bulgaria, implemented expansionaryfiscal and monetary measures aimed at buoying aggregate demand (Darvas, 2009). Fiscal policyexpansions came in the form of support for the most vulnerable, and for the unemployed inparticular. However, many countries provided credit to businesses, finance for infrastructureprojects and income tax reductions (Darvas, 2009). There is not sufficient space here to assess allof these spending programmes. What can be said is that due to the limited fiscal space the extraspending measures have generally been offset by consolidation measures. Consolidation wasgenerally implemented through public-sector wage and/or hiring freezes, consumption taxincreases as well as cuts in any other ‘non-essential’ areas. The silver lining is that the forcedconsolidation will further structural reforms needed to put national budgets on a more sustainablefoundation (IMF, 2009b). There are concerns among some economists that European leadershave moved too quickly to embrace austerity and that there is a general risk of inducing a doubledip recession should Europe’s governments radically reduce expenditure at what is still aeconomically vulnerable moment. Indeed, the timing of the withdrawal of stimulus measures hasbeen a matter of great debate this year. Clearly, each country must consider its uniquecircumstances, but it is crucial to recognise that, across the world, weak demand remains afundamental hindrance to a strong recovery.
9
For non-EU members in the CEE Albania, Belarus and Montenegro are excluded, as the latest datafrom the EIU does not include their revised budgets. With the EBRD’s data from November 2009, thenon-EU member’s fiscal balance is -1.0% of GDP, unweighted.
217 ESCEW 10 E bis
14
49. Banking system insolvency has also been a concern. Following the European Commission10directive, 12 CEE countries increased government-guaranteed deposit insurance. The EUmembers raised insurance to the recommended €50,000 level, while Albania and Croatia doubledand quadrupled deposit guarantees, respectively. Liquidity injections and bank re-capitalisationpolicies were also introduced, although at levels lower than in the more mature open-marketeconomies. This was largely due to the prominent position of foreign-owned banks in the CEE(EBRD, 2009). Of the six countries that engaged in banking sector support, Russia and Ukraineoffered the largest and most direct support to their respective banking systems. This is notparticularly surprising as both are among the CEE countries with the lowest shares offoreign-owned banks and two of the highest shares of state-owned banks (EBRD, 2009). Bosniaand Herzegovina and Montenegro are small, relatively open economies but with significantforeign-bank presence (foreign banks owned 84.6% and 95% of banking assets in 2008). Yet,their liquidity injection (and, for Bosnia and Herzegovina, bank recapitalisation) programmes wereimplemented under the IMF and other international bodies in order to reduce widespreaduncertainty. Finally, Hungary and Latvia stand out as the most advanced economies of the six; yettheir fiscal positions entering the crisis were particularly weak. Although Latvia had strongfundamentals in 2008, its banking system was seen as more vulnerable than its neighbours, inpart because foreign banks owned only 65.7% of Latvian assets, against 91.8 and 98.1% inLithuania and Estonia respectively. Furthermore, Latvian state-owned banks accounted for almost20% of banking assets in 2008, second to only Belarus and Russia.50. Indeed, the clear and committed support of foreign institutions, including the IMF, the EIBand foreign-owned banks operating in the CEE, played decisive roles in the crisis (EBRD, 2009).The European Bank for Reconstruction and Development helped stabilise the region’s banks byorchestrating an orderly deleveraging process among the region’s banks which helped avoid apanic. The EU provided low interest loans to help countries maintain repayment schedules and theIMF provided vitally needed credit without imposing the kind of conditionality that provedproblematic in past crises.51. Finally, extraordinary measures have been taken by many countries attempting to defendtheir currency’s exchange rate. Bulgaria, Croatia, Estonia, Hungary, Latvia, Lithuania andRomania’s pegged currencies came under immense pressure due to the sudden reversal ofcapital flows. In February 2009, the cost of insuring these governments’ five-year bonds againstdefault each rocketed above 600 basis points (peaking at almost 1,200 bps for Latvia). Defendingcurrency pegs required that their central banks expend a significant proportion of theirforeign-exchange reserves. For those countries with large outstanding debts denominated inforeign currency, devaluation was not seen as a desirable option, compelling governments toengage in austerity measures to defend the exchange rate. This was particularly the case in theBaltic States which saw growth, wages and employment plummet as a result. Even more costlywas Russia’s failed defence of its managed float: after spending one third of its enormousstockpile of reserves, sterilisation measures were ultimately abandoned and the rouble wasallowed to depreciate by 20% (Darvas, 2009). Ukraine also failed to defend its managed float, butwhen the default-insurance market spread surpassed 5,000 basis points the country shifted to afree-floating policy under the auspices of an IMF Stand-by Agreement. Of course, those countrieswith floating currencies (i.e., Czech Republic and Poland) were not obliged to defend costly pegs,and resulting depreciated currencies will bolster exports in 2010 and 2011.
10
Albania, Bulgaria, Croatia, Czech Republic, Estonia, Hungary, Latvia, Lithuania, Poland, Romania,Slovak Republic, Slovenia.
217 ESCEW 10 E bis
15
IV.A.
THE LATVIAN AND BULGARIAN EXPERIENCESLATVIA
52. This Committee has had the opportunity to visit both Latvia and Bulgaria this year and willvisit the Czech Republic after this report goes to press. The Latvian case is particularly interestingas it suffered Europe’s greatest economic contraction. After contracting by 4.2% in 2008, Latvia’sgross domestic product shrunk by an astounding 18% in 2009 and will likely fall another 2.3% in2010 before finally returning to growth in 2011 (IMF, WEO). In the decade preceding the crisis,Latvia and the other Baltic States were the fastest growing economies in Europe. Latviaconsistently recorded real growth rates of over 10%. Rising levels of trade and investment duringa global era of easy credit fed expectations for future growth. As foreign capital flowed in andcredit rapidly expanded, prices edged upwards. Inflation reached nearly 18% by mid-2008 (BoLpresentation). But wage levels were rising far more quickly than workers’ productivity rates(Vilipisauskas, Rose-Roth). Average nominal wages more than doubled between 2000 and 2008,while productivity rose by less than 50% (BoL). Cheap euro-denominated credit fuelled whatproved to be an unsustainable pace of wage hikes. Yet it was politically difficult to advocate a slowdown in credit expansion in the face of the country’s unparalleled growth. Indeed, credit bubblesare easiest to detect after they have burst; but there were nevertheless clear signs of trouble. Thecurrent account deficit rose nearly fourfold, from 6.6% of GDP in 2002 to 22.3% in 2007.Paradoxically, as the economy lost its competitive advantage in labour costs terms, economicgrowth continued to soar as credit-fuelled consumption and investment compensated for theworsening trade balance. This, of course, was not sustainable and was a central factor in thecountry’s economic collapse.53. Along with Estonia and Lithuania, Latvia had been considered to be on an inside track foreuromembership. The Bank of Latvia had dedicated itself to maintaining a stable exchange ratewith the euro (at 0.703 lats/1 €). For all intents and purposes, this deprived it of exercising anindependent monetary policy. When the crisis struck, however, foreign capital fled the country - adevelopment that immediately squeezed businesses and consumers who had relied on cheapcredit. Had the exchange rate been flexible, the central bank would have been in a position tolower the interest rate or engage in quantitative easing to increase the availability of credit. Undera fixed exchange rate regime, however, there is no leeway to do so. The Bank of Latvia wasdetermined to maintain the pre-crisis exchange rate despite the massive ‘internal devaluation’ thatresulted. This was a key factor in the plummeting growth and soaring unemployment that ensued,but the authorities felt that given the high level of foreign currency-denominated debt, adevaluation would have had more adverse effects over the long run and rendered eventual euromembership all the more elusive.54. The Governor of the Bank of Latvia argued that devaluation would have damaged thecountry’s credibility and increased the level of bankruptcies. Moreover, it would have generatedfewer incentives for improving productivity and still would not have been sufficient to reverse thehuge current account deficit (NATO PA, spring). In effect, Latvia’s decision to maintain its fixedexchange rate required a high degree of suffering over the short term in order to lay thefoundations for longer-term growth. There are some signs that this shock therapy strategy isbeginning to work. This summer the EBRD revised its growth forecast upwards (from -3.0% to-2.0% for 2010), and the Economist Intelligence Unit notes that since January 2010 year-on-yearindustrial output has been increasing at respectable rates. And, as of June 2010 the Latvianeconomy reached industrial output levels equivalent to peak output in 2008 (EIU, 6 July 2010) andthere are signs that its competitiveness is being restored.55. The response to the economic collapse in Latvia was further hindered by restricted fiscalleeway. Latvia had been running relatively minor budgetary deficits in the years before the crisis,but even in 2008 falling tax revenue and increasing demands for social services generated a
217 ESCEW 10 E bis
16
deficit equivalent to 4% of GDP. To support the overwhelmed social system and to regain someeconomic stability Latvia turned to the IMF, the EU and the Scandinavian governments inDecember 2008 for a €7.5 billion rescue package (FT, 2010a). Under the agreement, Latvia’sbudget deficit was set to reach 8.5% of GDP in 2010. This gave it leeway to provide someprotection for the poorest and to finance active labour market policies and temporary jobsprogrammes (IMF, 2010d). The World Bank has also offered support for these emergencyprogrammes (World Bank, 2010b). This unprecedented Stand-by Agreement runs until the end of2011. But with the pick up in economic activity, the Latvian government now feels that it can avoiddrawing upon the rescue capital put up by Scandinavian donors. This would be a very welcomedsign of a stable recovery.
B.
BULGARIA
56. Bulgaria experienced less of a downturn than Latvia over the course of the global economiccrisis, but it has had to cope with other structural problems posing important potential barriers tolong-term economic growth. Although the country underwent a rapid transition to prepare itself forEU membership, the problems of corruption and persistent inadequacies in its judicial system havebeen of great concern to the European Union and to Bulgaria’s domestic reformers. In otherareas, its reforms have been more successful and, as a result, the country was less vulnerablethan it otherwise would have been as the global economy slowed. Even prior to joining the Unionin 2007, Bulgarian public finances remained within the bounds of the SGP (Stability and GrowthPact). Indeed, the State was generating budgetary surpluses and public debt had begun to fall(reaching 14.1% of GDP in 2008). Like Latvia, Bulgaria has pegged to the euro and that peg wasmaintained during the recent crisis. This policy helped encourage significant capital inflows duringthe past decade but credit conditions were significantly tight in Bulgaria due to regulatorymeasures arising out of the 1997 financial crisis. During the boom years, Bulgaria’s GDP grew bya relatively moderate 6 to 7% and it underwent a comparatively minor but nonetheless very painfulcontraction of 5% in 2009 (IMF, 2010c).57. Bulgaria’s fiscal caution is rooted in the inflationary crisis in 1997 (BNB Meeting). Theeconomic havoc that resulted informed successive governments’ efforts to rein in spending andensure as much stability and predictability as possible. Although pegging the currency to the eurodeprived the central bank of monetary autonomy, tight financial regulation helped rein in thebanks. For example, when credit growth reached 45% in 2007 the authorities responded byincreasing the capital adequacy ratio to 17% - far higher than the Basel II requirements (BNBMeeting). This capital buffer proved very useful in 2008 and 2009 as foreign investment dried up.Capital inflows fell by 54% from 2008 to 2009, but domestic capital stocks generated throughthese regulatory measures helped keep the economy from falling off a cliff (UNECE, 2010).Bulgaria was hardly unique in this regard. The Czech Republic is another country that ensured thatits banking practices and its budget were operating on a sustainable basis. (The Economist,20 March 2010)58. The government also maintained an admirable degree of fiscal discipline in the years beforethe crisis. This, in turn, accorded it a degree of flexibility in the recent downturn. The budget deficitfor 2010 is estimated at 4% of GDP – the first time in over a decade that Bulgaria’s shortfall willexceed 3% (EIU, 2010). Yet infrastructure and social outlays have partly counteracted some of theworst aspects of the crisis and headed off potential social disruptions that the downturn might haveotherwise induced. Bulgaria, however, continues to confront competitiveness challenges. A largeshare of Bulgaria’s exports is in the textile sector and it is directly competing with China and otherlow-cost East Asian producers (BNB Meeting). Corruption continues to burden the nationaleconomy and weakens the effectiveness of the State. Addressing this will be essential toimproving the country’s competitiveness and Committee members learned that doing so hasbecome a top priority of the current government.
217 ESCEW 10 E bis
17
V.
IMPACT ON MILITARY EXPENDITURE
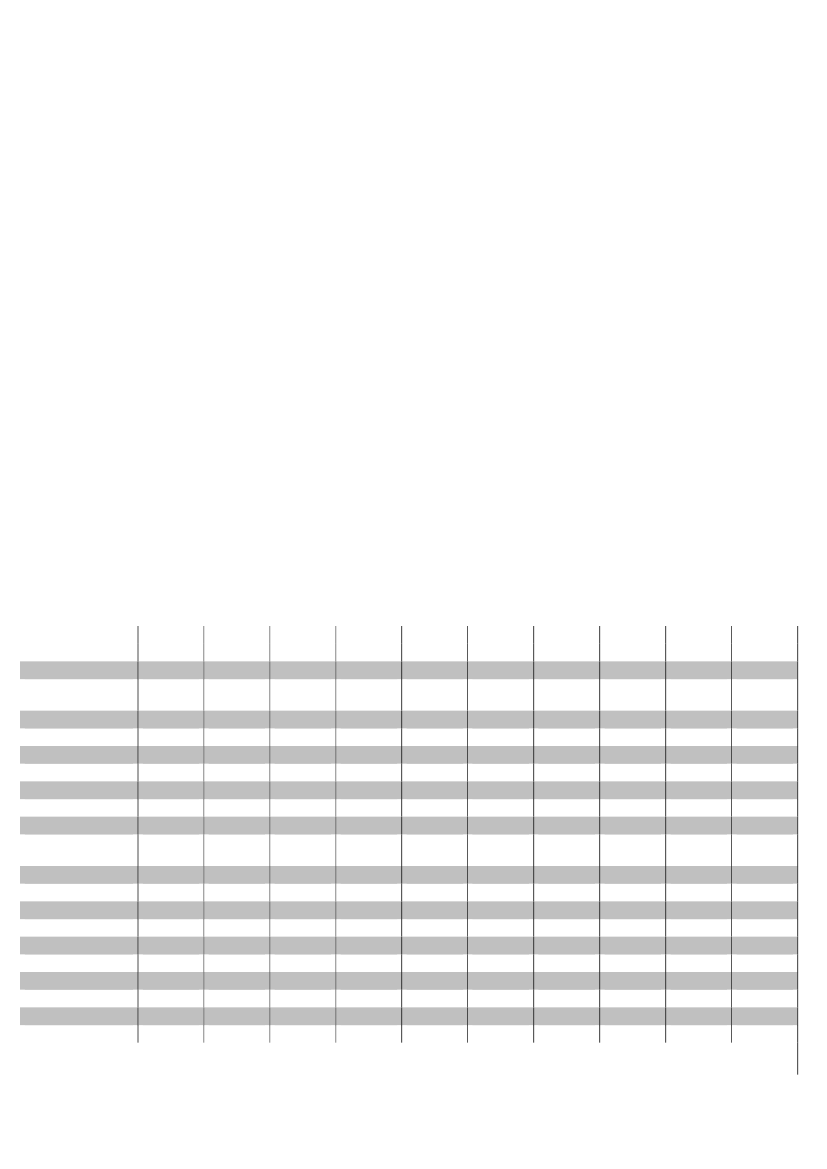
59. As governments across the region consolidate their budgets through spending cuts and taxincreases, there are concerns in NATO circles about the impact on military expenditure. Evenbefore the crisis, several countries of the former Yugoslavia had been scaling down their militarybudgets, as had the Czech Republic and Hungary; nevertheless the region’s overall militaryspending increased roughly 7 to 8% in the three years before the crisis struck (SIPRI, 2010). Thelatest data from SIPRI shows that, as an unweighted average, military spending increased by4.2% in 2008 and declined by 1.2% in 2009. When considered as a proportion of GDP, however,the region’s large contraction in 2009 meant that military spending increased from 1.8% to 2.1% ofGDP (with each country, save Montenegro, maintaining or increasing their proportional allocation).It is important to consider that there is less flexibility to adjust defence spending in the short termso the impacts of the crisis on defence spending may only be evident later.60. Of course, these averages hide important differences within the diverse region which aredriven by threat perceptions and strategic ambitions as much as by economic factors. Bulgaria,Croatia, Estonia, Lithuania, Moldova, Montenegro, Romania, Serbia, Slovakia and Ukraine all cutreal military spending by no less than 5.8% in 2009 (most cuts are in the 7 to 10% range). Quiteremarkably, Latvia and Russia both increased their respective defence budgets in 2008 and 2009.In light of its large economic contraction, estimates are that Latvia’s military budget increased from1.7% in 2007 to 2.6% of GDP in 2009. Russia’s spending increased from 3.5% to 5.0% (by far thelargest proportional spending increase in the CEE since the Balkan wars). This will obviously beof some concern to Russia’s neighbours. Russia’s immense size means that total militaryspending in the region increased from US$90.8 billion in 2008 to US$93.1 billion in 2009 – withRussia accounting for over 65% of this figure.Military Expenditure (USD millions)
2000
98.9296n/a9451,4113,2801822,07814642913914.2n/a7,0722,25029,7001,6921,1024432,65853,936
2001
112369n/a1,0461,3073,1552122,29218345744115.6n/a7,2402,36033,0001,3471,2415442,24557,567
2002
1123834531,0561,4143,3712532,23529948119218.3n/a7,3622,34836,6001,4901,2576042,38762,315
2003
1263883151,0761,1443,6632932,40234557717419.9n/a7,7072,42239,0001,3061,3346282,75865,678
2004
1384692831,0521,0023,5143092,22337260318317.8n/a8,1482,60440,6001,2071,2396672,97767,608
2005
1436112361,0769873,8423842,20143359417220.7n/a8,5322,75444,2001,0111,3436793,60672,825
2006
1757932271,0671,0963,5494321,97354564316326.369.98,8522,83948,4001,0201,3627784,04578,055
2007
2178652261,2391,1343,3185242,01060271418629.963.79,8632,72252,5001,1501,3777834,91784,441
2008
2568832431,2201,2992,8335061,86863472617336.871.210,6263,00058,3001,1361,4108294,81190,861
2009
2761,0362761,1271,1913,2464601,90069264820427.557.910,8602,61661,0001,0701,3168884,25893,149
AlbaniaBelarusBosnia andHerzegovinaBulgariaCroatiaCzech RepublicEstoniaHungaryLatviaLithuaniathe fYR ofMacedoniaMoldovaMontenegroPolandRomaniaRussiaSerbiaSlovakiaSloveniaUkraineTOTAL
Source:SIPRI Database on Military Expenditure, accessed 31 August 2010
217 ESCEW 10 E bis
18
VI.
RECOMMENDATIONS AND CONCLUSION
61. In the aftermath of the worst global economic crisis since the Great Depression, it is crucialthat all governments refrain from protectionist measures. The long-term costs of protectionism faroutweigh short-term and narrowly construed benefits. In particular, nothing about the current crisischanges our understanding of open trade, the benefits of which include higher growth, increasedconsumer choice and international solidarity.62. CEE governments will continue to face daunting social, political and economic challenges asa result of this crisis. With this in mind, the region’s governments will need to recognise that fiscalconsolidation is inevitable, but it must facilitate the kinds of structural reforms and investments thatwill encourage long-term growth as well as budgetary sustainability.63. Neither euro-membership nor flexible currency regimes will insulate countries from theimpact of global crisis. Appropriate monetary policies ultimately hinge not only on the economicfundamentals, institutions and practices of each country, but also on their unique economiccultures and their political, diplomatic and economic priorities.64. Over the long run, governments in the CEE as well as those throughout the OECD mustadjust their approach to fiscal policymaking to ensure that savings are generated during boomperiods to provide the necessary funds needed to finance spending measures during downswings.Doing so will help moderate rather than exacerbate the business cycle. This is not always easy todo, and institutional change as well as a frank public discussion about fiscal matters is essential.An important lesson of this crisis is that many governments have pursued pro-cyclical fiscalpolicies that triggered financial bubbles and ultimately deprived governments of the resourcesneeded to deal with the bursting of the bubbles. This must change. That said, most of thegovernments have managed very well in adjusting to new economic conditions, and some likeLatvia and Hungary have had to make massive adjustments to deal with large current account andbudget deficits. In some respects, this response might be a model for more timid policymakers inthe West who sometimes have been slow to react to these conditions. Finally, the courage andpatient sacrifice of the people of many CEE countries should be recognized as they have endureddifficult times with a remarkable degree of stoicism. These countries have generally maintainedpolitical and social stability as a result. This is a testament to the strength of these democraciesand their civil societies.65. Fiscal reforms should protect pro-growth programmes that improve human capital,encourage innovation, and build infrastructure. Spending cuts, for example, should targetinefficient State policies, while rationalizing pension plans and healthcare entitlements in order tomake them sustainable over the long term, particularly given demographic trends. Much of theregion needs to refine policies designed to cope with an ageing workforce, poor infrastructure andthe emergence of powerful direct competitors in Asia. This makes reform all the more essential.Some countries need to improve tax collection methods. Any increased taxes ought to focus onconsumption and natural resource use rather than penalising potential sources of growth.Obviously, ensuring public health and high education standards should remain a priority, as bothare essential to long-term economic success. Moreover, several countries could increaserevenues through more progressive tax regimes, which might lower the burden on the mostvulnerable segments of society. Again, many such reforms are also needed more broadlythroughout the OECD.66. A reconsideration of the secular benefits of full capital account liberalisation is in order.Short-term capital movements into and out of emerging economies can be highly destabilising,and some measure of control may be in order to help insulate fragile market structures from thewhims of the international investor community. Transition governments must be mindful of the
217 ESCEW 10 E bis
19
foreign currency-denominated debt that households are taking on. When this exceeds certainthresholds, the economy as a whole becomes highly vulnerable in a downturn.67. At the time of writing, it is not entirely clear if the world is headed for a second recession or ifthe current relatively weak rate of growth can be sustained. There are signs though that conditionsfor the poor could grow worse. Food prices, for example, are now rising and this hits the poordisproportionately. The solutions to this particular problem must include multilateral measures andmore open trade in food products. In this light, Russia’s decision to impose grain exportrestrictions will only exacerbate rather than improve the region’s food security and represents astep backwards for Russia’s food industry which has great potential to play an important role inworld markets.68. Defence budgets are vulnerable in the kind of downturn that is coursing through Europe.New NATO members are going to be under strong political pressure to cut defence budgets.Generating some degree of savings may be necessary and one way to do so is to create newefficiencies through enhanced European defence integration and defence industrial co-operation.Of course, more open transatlantic defence trade and co-operation can be particularly helpful inthis regard.
217 ESCEW 10 E bis
20
BIBLIOGRAPHYBerger, H., G. Kopits and I. Székely (2007), “Fiscal Indulgence in Central Europe: Loss of theExternal Anchor?”Scottish Journal of Political Economy,vol. 54, no. 1.BoL presentation – Governor of the Bank of Latvia, Spring Session 2010BNB Meeting – trip to Sofia, meeting with head of Bulgarian National BankBhagwati, Jagdish (1998), “The Capital Myth: the difference between trade in widgets and dollars”,Foreign Affairs,vol. 77, no. 3, May/June: 7 – 13.BIS (2009), Dubravko Mihaljek, “The financial stability implications of increased capital flows foremerging market economies”,BIS Papers No. 44.http://www.bis.org/publ/bppdf/bispap44.htmCEPR (2010), Mark Weisbrot and Rebecca Ray, “Latvia’s Recession: The Cost of Adjustment withan ‘Internal Devaluation’”,Center for Economic and Policy Research,February 2010.http://www.cepr.net/index.php/publications/reports/latvias-recession-cost-of-adjustment-internal-devaluation/Coulibaly, Brahima (2009), “Currency Unions and Currency Crises: An Emprical Assessment”,International Journal of Finance and Economics,vol. 14: 199 – 221.Darvas, Zsolt (2009), “The Impact of the Crisis on Budget Policy in Central and Eastern Europe”,Bruegel Working Papervol. 5, July.http://www.bruegel.org/uploads/tx_btbbreugel/wp_cesee_crisis_310709.pdfDarvas, Zsolt and Reinhilde Veugelers (2009), Bruegel, “Beyond the crisis: Prospects forTransition Economies”, mimeo, October.EBRD (2009),Transition Report 2009: Transition in Crisis?European Bank for Reconstruction andDevelopment.EIU (2009), “Saying ‘no’ to the WTO”,Business Eastern Europe, Economist Intelligence Unit,29June: 2, box.EIU (2010),Country Report: Bosnia and Hercegovina, Bulgaria, etc….EIU (2010),Country Reports:September:Bulgaria, MoldovaandSlovakia;August:Albania,Bosnia and Hercegovina, Croatia, Estonia, Former Yugoslav Republic of Macedonia, Hungary,Latvia, Lithuania, Poland, Romania, Russia, Serbia, Slovenia, Ukraine;July:MontenegroEuractiv (2008), “New members in EU funds spending frenzy”,Euractiv.com,13 February.http://www.euractiv.com/en/innovation/new-members-eu-funds-spending-frenzy/article-170251Eurostat (2010),Statistics Database.Accessed on 19 February 2010.Freedom House (2009),Nations in Transit 2009: Tables.http://www.freedomhouse.org/template.cfm?page=485Gordon Fairclough, “Hungary sets own path on economy,”Wall Street Journal,2 August 2010.Financial Times (2009), “Russia scraps WTO customs union bid”, 15 October.
217 ESCEW 10 E bis
21
Financial Times (2010a), “Latvia vote keeps IMF talks on track”, 21 January.Financial Times (2010b), “Doubts emerge about Ukraine reform,” 9 February.Financial Times (2010c), “Slovaks Mark fist year behind euro ‘shield’” 7 January.Financial Times (2010d), “Russia plans tariff rise on car imports” 30 August.“Fingered by Fate,”The Economist,March 20, 2010.Heritage Foundation (2010), Terry Miller and Kim R. Holmes,2010 Index of Economic Freedom.http://www.heritage.org/index/IMF (2006), M. Ayhan Kose, Eswar Prasad, Kenneth Rogoff and Shang-Jin Wei, “FinancialGlobalization: A Reappraisal”,IMF Working paper,WP/06/189, August.http://www.brookings.edu/~/media/Files/rc/papers/2006/08globaleconomics_rogoff/20060823.pdfIMF (2009a),World Economic Outlook Database.Accessed on 28 January 2010.http://www.imf.org/external/pubs/ft/weo/2009/02/weodata/index.aspxIMF (2009b),World Economic Outlook: Sustaining the Recovery,October.http://www.imf.org/external/pubs/ft/weo/2009/02/index.htmIMF (2009c), Camilla Andersen, ‘”Multi-Speed Recovery Seen for Europe”,IMF Survey Online,28December.http://www.imf.org/external/pubs/ft/survey/so/2009/car122809a.htmIMF (2009d), Roberto Cardarelli, Selim Elekdag, M. Ayhan Kose, “Capital Inflows: MacroeconomicIMFWorkingPaper,WP/09/40,March.ImplicationsandPolicyResponses”,http://www.imf.org/external/pubs/ft/wp/2009/wp0940.pdfIMF (2009e), Delia Velculescu, “Poland: Bright Spot in Recession-Hit Europe”,IMF SurveyMagazine: Countries &Regions, 13 August.http://www.imf.org/external/pubs/ft/survey/so/2009/CAR081309A.htmIMF (2009f), Selected Countries,Financial Position in the Fund,Accessed on 8 February.http://www.imf.org/external/country/UKR/index.htmIMF, (2010a), Olivier Blanchard, Giovanni Dell’Ariccia and Paolo Mauro, “RethinkingIMFStaffPositionNote,SPN/10/03,12February.MacroeconomicPolicy”,http://www.imf.org/external/pubs/ft/spn/2010/spn1003.pdfIMF (2010b), Dominique Strauss-Kahn, Press Conference, 14 January, Washington, DC.http://www.imf.org/external/np/tr/2010/tr101410.htmIMF (2010c),World Economic Outlook Database.Accessed on 23 August 2010.http://www.imf.org/external/pubs/ft/weo/2009/02/weodata/index.aspxIMF (2010d), Press Brief,IMF Completes Review under Stand-by Arrangement with Latvia andApproves €105.8 Million Disbursement,no. 10/297. July 21.http://www.imf.org/external/np/sec/pr/2010/pr10297.htm
217 ESCEW 10 E bis
22
Kaufman, Stephen “Obama: US Strongly Backs Russia’s World Trade Organization Bid”,America.gov,http://www.america.gov/st/business-english/2010/June/20100624165723esnamfuak0.6859247.htmlKrugman, Paul (1999), “O Canada: A neglected nation gets its Nobel”,Slate,19 October.http://www.slate.com/id/36764/Kuddo, Arvo (2009), “Employment Services and Active Labor Market Programs in Eastern Europeand Central Asian Countries”,Social Protection & Labour, World Bank,SP Discussion Paper no.0918, October.http://siteresources.worldbank.org/SOCIALPROTECTION/Resources/SP-Discussion-papers/Labor-Market-DP/0918.pdfLewis, John (2009), De Nederlandsche Bank, “Fiscal policy in Central and Eastern Europe withreal time data: Cyclicality, inertia and the role of EU accession”,DNB Working Paper,No. 214,July.http://www.dnb.nl/en/binaries/Working%20paper%20214_tcm47-220404.pdfLucas, Robert E. (1990), “Why Doesn’t Capital Flow from Rich to Poor Countries?”AmericanEconomic Review,vol. 80, no. 2, May: 92 – 96.Naotaka Sugawara, Victor Sulla, Ashley Taylor and Erwing R. Tiongson, “The crisis hits home:Stress Testing households in Europe and Central Asia,Economic Premise,May 2010, Number 12.Schnabl, Gunther (2009), “Exchange Rate Volatility and Growth in Emerging Europe and EastAsia”,Open Economies Review,20: 565 – 587.SET (2010), “US Report: Albania tops economic freedom scale in the Balkans”,SETimes.com,3March.http://www.setimes.com/cocoon/setimes/xhtml/en_GB/features/setimes/features/2010/02/03/feature-03Solow, Robert (1956), “A Contribution to the Theory of Economic Growth”,Quarterly Journal ofEconomics,vol. 70: 65 –94.Stockholm International Peace Research Institute (2010),SIPRI Military Expenditure Database.Accessed 31 August 2010.http://www.sipri.org/databases/milexUNECE (2009),United Nations Economic Commission for Europe Statistical Database.Accessedon February 10.http://w3.unece.org/pxweb/Dialog/UNECE (2010),United Nations Economic Commission for Europe Statistical Database.Accessedon 22 August 2010.http://w3.unece.org/pxweb/Dialog/The Economist,“What went right,” March 20, 2010.World Bank (2009),Remittances Data,Accessed on 19 February 2010. November.http://siteresources.worldbank.org/INTPROSPECTS/Resources/334934-1110315015165/RemittancesData_Nov09(Public).xlsWorld Bank (2010a), “Global Economic Prospects 2010: Crisis, Finance, and Growth”IBRD/WB.http://web.worldbank.org/WBSITE/EXTERNAL/EXTDEC/EXTDECPROSPECTS/GEPEXT/EXTGEP2010/0,,contentMDK:22438006~menuPK:6665268~pagePK:64167689~piPK:64167673~theSite
217 ESCEW 10 E bis
23
PK:6665253,00.htmlWorld Bank (2010b), Press Release.World Bank Group President Zoellick Visits Latvia to DiscussSupport During Global Economic Hard Times,2011/066/ECA. 13 August.WTO (2010), “Members and Observers”, WTO.org, Accessed on March 1.http://www.wto.org/english/thewto_e/whatis_e/tif_e/org6_e.htmVilipisauskas, Rose-Roth seminar in Helsinki 2010
__________________