Uddannelsesudvalget 2010-11 (1. samling)
UDU Alm.del Bilag 322
Offentligt
Henrik Christoffersen and Karsten Bo Larsen.
Comparison of cost and performance in theprivate and public primary and lowersecondary schools in DenmarkMed dansk sammenfatning:Udgifter og resultater i frie grundskoler ogfolkeskolerCEPOS arbejdspapir nr. 13
1
CEPOS’ publikationer er gratis tilgængelige for alleonline på www.cepos.dk, men kan også bestilles i tryktform gennem CEPOS forlaget,Landgreven 3, 3. sal, 1301 København KTelefon: 33 45 60 30 eller fax: 33 45 60 45E-mail: [email protected]� Copyright: 2010 CEPOS, Henrik Christoffersen ogKarsten Bo LarsenMindre uddrag, herunder figurer, tabeller og citater ertilladt med tydelig kildeangivelse. Skrifter, der omtaler,anmelder, citerer eller henviser til nærværende, bedessendt til CEPOS.1.udgave, 1. oplag� Omslagslayout: CEPOSTryk: CEPOS ForlagetForlag: CEPOS ForlagetOplag: 200ISBN nr.: 978-87-92581-21-1
Maj 2011
2
Henrik Christoffersen og Karsten Bo Larsen
Comparison of cost and performance in theprivate and public primary and lowersecondary schools in DenmarkMed dansk sammenfatning:Udgifter og resultater i frie grundskoler ogfolkeskoler
CEPOS arbejdspapir nr. 13
3
ForordInden for de sidste par år har Folketinget ved flere lejligheder gennemførttiltag, som har gjort det vanskeligere at drive frie grundskoler i Danmark.Det er bemærkelsesværdigt at dette er sket uden at der har foreligget ogværet inddraget noget solidt grundlag i form af undersøgelser af de friegrundskolers præstationer og omkostninger. Det forhold har tilskyndet tiludarbejdelsen af analysen i det nærværende papir.Selve arbejdspapiret er engelsksproget. Baggrunden er, at det indgår iden almindelige internationale forskningsudveksling. Det er såledesblevet antaget til præsentation på den årlige samling i det europæiskeforskernet for forskere, som beskæftiger sig med økonomisk teori ompolitiske og bureaukratiske systemer, European Public Choice Society.Arbejdspapiret indledes imidlertid med en dansk sammenfatning.Det statistiske analysearbejde i forbindelse med papiret er udført afstud.polit. Jeppe Madsen.Juni 2011Henrik ChristoffersenForskningschef i CEPOS
4
IndholdSammenfatningDanish primary and lower secondary schools - grants, incentives and competition betweenschoolsQuality of the education in primary and lower secondary schoolsCost of production in the Danish primary and lower secondary schoolsComparing cost at private and public schoolsComparing economic performance among private and public schoolsConcluding remarksReferences
5
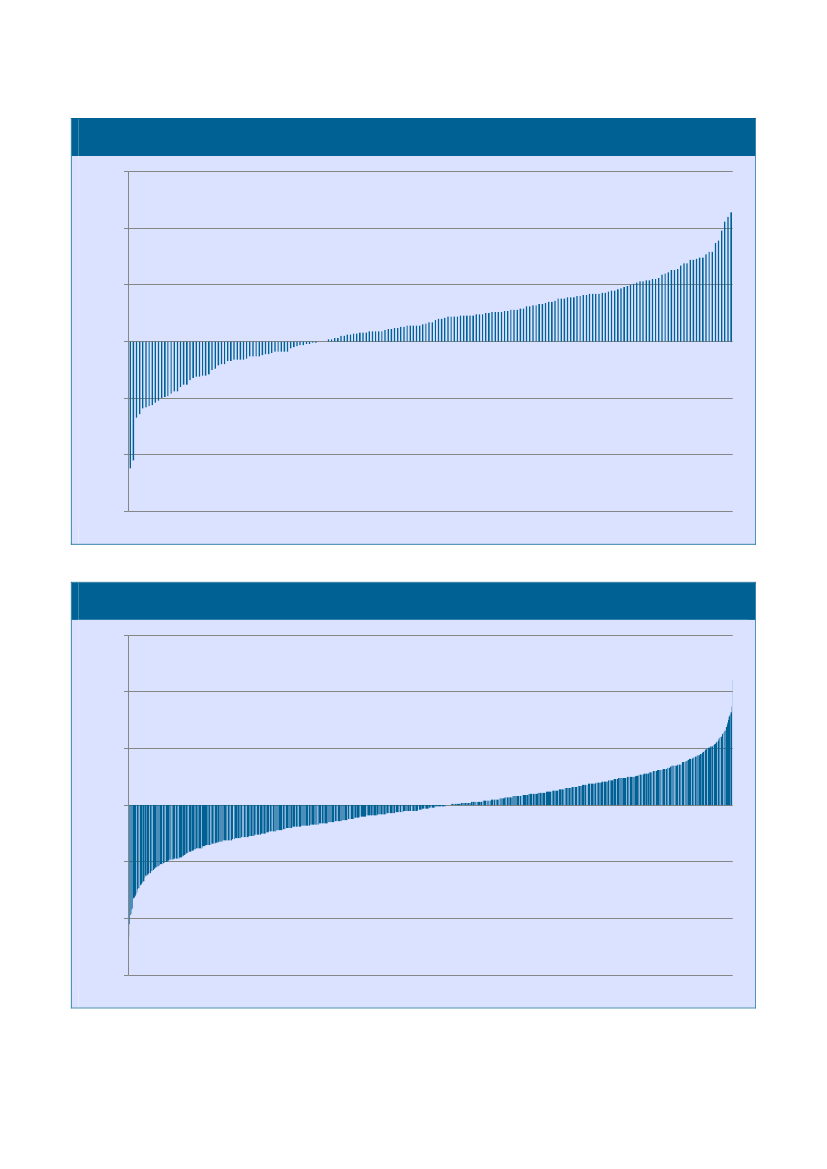
SammenfatningI arbejdspapiret om resultater og ressourcer i offentlige skoler og frie grundskoler analyseresforskellen i kvaliteten i undervisningen mellem de to skoleformer. Kvalitet opgøres i denneforbindelse som skolernes opnåede undervisningseffekter. Undervisningseffekten er et mål for,hvor meget den enkelte skoles karaktergennemsnit i de centrale kernefag ved folkeskolensafgangsprøve afviger fra det forventede niveau, når man i en statistisk regressionsanalyse tagerhøjde elvernes sociale, økonomiske og etniske baggrund. Undervisningseffekten er således et målfor, hvor meget skolens undervisning hæver eller sænker elevernes præstationer over eller underdet forventede niveau.Analysen viser, at de frie grundskoler generelt set leverer bedre resultater end de offentlige skoler.Der er naturligvis en betydelig spredning i undervisningseffekten for både de frie grundskoler ogde offentlige skoler, men det er en langt større andel af de frie grundskoler, der opnår et resultatfor deres elever, som ligger over det man skulle forvente, når man betragter elevernes sociale,økonomiske og etniske baggrund, jf. figur 1 og 2.Det kan således med en høj grad af statistisk sikkerhed påvises, at de frie grundskoler levererbedre undervisningsresultater end de offentlige skoler.De bedre resultater i de frie grundskoler kan ses i lyset af, at de frie grundskoler har lavereomkostninger pr. elev end de offentlige skoler. Der gennemføres i arbejdspapiret en mereindgående analyse af omkostningsstrukturen i henholdsvis offentlige skoler og frie grundskolermed henblik på at komme nærmere på en forklaring af, hvorfor de frie grundskoler gennemsnitligtset er bedre og billigere end de offentlige skoler:I de offentlige skoler er elevernes sammensætning i forhold til social, økonomisk og etniskbaggrund den afgørende forklaring på de enkelte skolers gennemsnitlige omkostninger pr. elev.Derimod påvirker elevernes baggrund ikke omkostningerne pr. elev i de frie grundskoler. Dettekan i øvrigt ses i sammenhæng med, at der ikke kan påvises en mere væsentlig statistisksammenhæng mellem elevsammensætningen og skolernes ejerskab.
6
Figur 1: Afvigelse fra forventet karaktergennemsnit i frie grundskoler – arrangeret stigende1,5
1
0,5
0
-0,5
-1
-1,5
Figur 2: Afvigelse fra forventet karaktergennemsnit i offentlige folkeskoler – arrangeret stigende1,5
1
0,5
0
-0,5
-1
-1,5
7
I de frie grundskoler er det udelukkende den gennemsnitlige skolestørrelse, som kan forklareforskelle i omkostningerne pr. elev mellem skolerne, hvor omkostningerne pr. elev falder, nårantallet af elever stiger. Skolestørrelse forklarer derimod ikke forskellene i udgifter mellem deoffentlige skoler. Det tyder således på, at de frie grundskoler indhøster stordriftsfordele, men detskal i den forbindelse understreges, at de frie grundskoler gennemsnitligt set er mindre end deoffentlige skoler og at der eventuelt kun er fordele ved en øget skolestørrelse op til et vist niveau.En stor del af de offentlige skoler kan således være så store, at der ikke er yderligerestordriftsfordele, som kan indhøstes.De frie grundskoler i Danmark kan ikke siges at operere på et marked i traditionel forstand –eksempelvis kommer deres væsentligste indtægter fra offentlige tilskud, der følger elverne, ogskolerne må ikke give afkast til investorer. De frie grundskoler er dog underlagt en større grad afkonkurrence end de offentlige skoler, da dårlige resultater for de frie grundskolers elever kanmedføre elevflugt, hvilket vil underminere skolens økonomi, så den kan blive tvunget til at lukke.Et tilsvarende scenarie er utænkeligt for en offentlig skole.Konkurrenceelementet i form af en trussel om lukning ved dårlige resultater er måske denvæsentligste forklaring på, at de frie grundskoler opnår bedre resultater. Når det kommer tilkonkurrence har de frie grundskoler en række muligheder i forhold til de offentlige skoler hvadangår frihedsgrader med hensyn til tilrettelæggelsen af undervisningen.De reaktionsmønstre, som synes at ligge bag de fundne resultater, tegner en grundlæggendeforskel i rationaler i de to måder at organisere skoler på. Når en fri grundskole får elever medsærlige udfordringer, så bliver skolen presset til at løse problemerne, da det ellers kan betyde, atde øvrige elever i sidste ende forlader skolen og at det bliver vanskeligere at rekruttere nye elever.Et sådant rationale ser ikke ud til at gælde i de offentlige skoler, hvor en stor andel af elever medsærlige problemer i relation til etnicitet, sociale forhold mv. vil være et argument for, at skolenskal have tildelt flere ressourcer, lige som en sådan elevsammensætning for skolen kan tjene somforklaring, såfremt den leverer dårligere resultater.
8
AbstractThe paper analyzes the quality and cost of the education in the public and private primary andlower secondary schools in Denmark. It is shown that the private schools have at significantlyhigher quality (higher grades when adjusted for differences in socioeconomic background amongthe pupils), and significantly lower costs. We search for explanations of this result, and we findthat, even though the Danish school system is designed to make public and private schoolscompete mutually, only the private schools behave as if they were operating on a competitivemarket.Jel: H42, H52Keywords: Private and public production of education, incentives to reduce cost, market marketmechanism, market failure policy failure.
Paper presented at the 2011 meeting in European Public Choice Society, University of Rennes,May 2011
9
Danish primary and lower secondary schools - grants, incentives andcompetition between schoolsDanish parents have in principle the freedom to choose the school that they want their children toattend.If they send the child to a public school it is free of cost because the public schools are fullyfinanced by taxes. The Danish municipalities are responsible for running the public schools, andthey have to offer education to any child that is between 6 and 16 years old and whose parentsare living in the municipality. In principle the parents are free to choose any public school in theirown or another municipality, but in practice the schools can refuse new pupils if they do not havecapacity for them, and if it will be overly expensive to increase the capacity of the school (buildingnew classrooms, hiring new teachers etc.). In the legislation there exists no clear definition of theconditions which justify that a school refuses to admit a child, but the municipalities make as anexample their own local rules for the maximum number of children in a class.The Danish municipalities receive general grants from the central government, and a proportion ofthe grants is calculated from an indicator based on the number of children between 6 and 16multiplied by the average expenditure pr. pupil in all Danish public schools last year (corrected forinflation and possible politically decided increases in the grants to the primary and lowersecondary schools). The municipalities can choose to spend more or less than the average cost perpupil; that is a question of priorities and the economy of the municipality (the income-level of thecitizens, tax-rate etc.). The Danish municipalities have in principle the right to tax their owncitizens, but since 2001 a liberal-conservative government has enforced a so-called tax-freeze onthe municipalities, which in practice makes it very difficult for the municipalities to change theirtax-rates.When a child moves from one public school to another public school the money follows the child,so that the receiving school also receives a higher budget. There is a variation amongmunicipalities according to how the school budget is calculated, but the main rule is that theaverage cost of a pupil in the municipality follows the child like a kind of voucher, when childrenmove from one public school to another. The rationale is to give parents as much freedom ofchoice as possible and to increase the competition among public schools to provide the besteducation.A similar system is used when children move from a public school to a private school. The publicschool loses grants equal to the average cost of a pupil in the municipality. The private schoolreceives 75 pct. of the average cost per pupil in public schools. The municipality only pays 85 pct.of the public contribution to the private school – the rest is financed by national taxes. A basicargument why the private schools are compensated only 75 percent of the average cost in publicschools is, that it is assumed that private schools can practice cream-skimming with the
10
consequence that children with learning disabilities, bad behavior, non-academic familybackground etc., making them more difficult and more costly to teach, will be overrepresented inthe public schools.The private schools are allowed to charge a supplementary tuition fee, but such fee only covers alimited part of the cost of the educational activities in the private schools (Approximately 4percent on average).About 15 pct. of Danish children attend a private school. Private schools in Denmark are notallowed to earn profit to private school owners but are self-governing independent institutionsregulated by the Ministry of Education. They are based on a more than hundred years old traditionand they are offered freedom to organize education within wide boundaries.It is almost impossible that a public school would close because of pupils moving to other schools.The main reason is that the municipalities have a legal obligation to provide education for allchildren between the ages of 6 and 16. With only 15 pct. of children attending private schools thecapacity of the private schools would in the short run set a natural maximum for the number ofchildren leaving the public schools. Public schools have been closed, but this has been caused bydemographic changes in certain parts of Denmark, which reduces the number of children living inthe local area to a point where it´s too expensive or even impossible to run an averagelyfunctioning school.All schools can gain higher grants by attracting more pupils, but only the private schoolsexperience the threat of exit.In this paper we analyze the cost and performance of public and private schools in Denmark. Ourhypothesis is that the private schools will come up with lower costs per pupil and with a higherquality of education than the public schools. We base this hypothesis on the facts that users ofprivate schools are confronted directly with the full marginal costs of running the school and thatthe private schools operate on more market-like conditions than the public schools, because theprivate schools, unlike the public schools, can be forced to close down if their performance is toopoor.
11
Quality of the education in primary and lower secondary schoolsTo test our hypothesis we construct an indicator for the quality of the education followingChristensen (2009). We are doing so by isolating the effect of performance of the school in aregression where the average marks at the final exam for the single pupil after the obligatory 10years of basic education is explained by a series of variables representing circumstances that couldhave an effect on the learning abilities of the child and which cannot be changed by theperformance of the school. This procedure has been made on an individual level by combining theDanish peoples-registration-number-systems data files together with other central governmentdata files covering income, education, children etc. All the variables used in the analysis of schoolperformance are listed in the appendix. The part of the average mark of the child that cannot beexplained by social background, genetic inheritance etc. (the residuals) can be interpreted as ameasure of school performance or, in other words, the ability to raise/lower the results of thechild above/below the expected average level for children with the same social background. Theresults for the individual pupils can be aggregated to school or municipal level.In this paper we use this measure of school-performance to investigate if there is any differencebetween the performance of public and private schools. In a logistic regression model we try toexplain the performance by a dummy variable for private or public school. The results are shownin table 1.Figure 1: Logistic regression private/public school* (dummy) explained by school-performancecoefficientSchool-performanceConstant-1,801,78z-value-6,9720,72P>|z|0,0000,000
The dummy is 1 for a public school and 0 for a private school. The dataset is presented in figure A1 and A2 in the appendix.
The logistic regression shows that the private schools perform significantly better than the publicschools. In the following parts of the paper we will try to explain why the private schools performbetter than the public schools.Every person having an address in Denmark are registered in the Danish peoples-registration-number-systems, but if a person have been living abroad for many years the Danish publicdatabases do not contain information about income, education etc. If we can´t get informationabout all the variables listed in the appendix for at least one of the parents then the pupil isexcluded from the analysis. Schools with useful parent-data for less than 14 pupils taking the finalexam are excluded from the analyses. This means that all small schools and the few Danishinternational schools are excluded from the analysis. Furthermore the continuation schools areexcluded from the analysis because a lot of these schools focus on education to a certain kind ofpupils – par example pupils with learning disabilities, pupils with a special talent for music etc.which would create a selection bias in the dataset. Finally a lot of Danish schools do not have anypupils taking the final exam because they only take care of the first seven years of the obligatory
12
10 years of basic education. Totally this means that the data set used in the analysis consists of1.214 Danish schools - 192 private schools (35 percent of the 489 private schools in Denmark) and1022 public schools (67 percent of the 1519 public schools in Denmark).
13
Cost of production in the Danish primary and lower secondary schoolsChristoffersen and Larsen (2010a) find that private schools are on average variable costs at least12 percent cheaper per pupil than public schools, so the first impression of our search is that theprivate schools are better as well as cheaper. To investigate this further, we analyze the cost pr.pupil in public and private schools. Unfortunately, the private and the public schools use differentaccounting principles according to cost of capital, so it is impossible to calculate comparablemeasures for the average total cost. Instead we use expenditure on wages pr. pupil, which is veryclose to the average variable cost, since wages are by far the biggest item of expenditure in boththe public and the private schools. It is possible to get accounting data for the individual privateschool in Denmark, but that is not the case for the public schools in the municipalities. Accountingdata for the public schools exist only on the municipal level, and in the following analysis of thecost in public and private schools we also aggregate data for the individual private schools to themunicipal level. The dataset consists of the 171 out of the 192 private schools in the performance-analysis that have been delivering accounting-data to the central database used by The DanishMinistry of Education for supervision of the private schools (39 percent of the 489 private schoolsin Denmark) and the 69 municipalities where we have data about cost in both the private and thepublic schools (70 percent of the 98 municipalities in Denmark). The data for wage per pupil inprivate and public schools are presented in figure A3 and A4 in the appendix.We formulate three basic hypotheses about what decides the cost of educating children between6 and 16 years old. The hypotheses are shown in figure 2.
14
Figure 2. Explaining the cost per pupil in the Danish primary and lower secondary schools in2007: Three hypothesesHypotheses and variablesExplained variable: Wages per pupilVariable explanationCost of wages in public and private schools aggregated tomunicipality-level (data from Statistics Denmark).
Hypothesis 1: weak socio economic structuresH:1: Socioeconomic index
The expected average marks calculated in the regressionused to find the school-performance can be used as asocioeconomic index (the higher the value is, thestronger are the socioeconomic structures)
Hypothesis 2: ScaleH:2: Average school size
Average number of pupils per school(Data from the Ministry of Education)
Hypothesis 3: CompetitionH:3: Private or public school
Data from the Ministry of Education
The socioeconomic structures:H:1The expected average marks calculated in the regression used to find the school-performancecan be used as a socioeconomic index (the higher the value is, the stronger are the socioeconomicstructures). The hypothesis states that it is – all other things being equal - less costly to educatechildren from higher social classes, because they have been raised to behave in a manner that isbetter suited for traditional teaching in classrooms and they do not have other problems that theschool must deal with (social and economic problems at home).Scale:H:2sets focus on average school size in the municipality. The hypothesis states that there isexpected to be economies of scale in running primary and lower secondary schools.
Competition:H:3The Danish school-system is designed to make all schools – private or public – compete witheach other to attract children. The grants follow the child, and therefore the schools can benefitfrom a higher number of pupils, but there is not a perfect market-competition working. The grants15
are in principle following the child, but the grant size is decided by the central or local governmentand does not work like a real price mechanism that determines the market price per child. Ourhypothesis is that the private schools are operating on more market-like conditions because they,as opposed to the public schools, can be forced to close down, if they fail to attract enoughchildren.
The results of the regression are shown in figure 3.Figure 3: Regressions for wage per pupil explained by all variables in figure 2CoefficientSocioeconomic indexAverage school sizeDummy (1=public, 0=private)-269,79-12,2410.929,81t-value-1,74-3,3310,4P>|t|0,0840,0010,000
The model is a simple linear model explaining the wage per pupil by all variables from Figure 2.The regression rejects the hypothesis that wages per pupil depend upon weak socioeconomicstructures, but it is very close to being accepted on a 5 percent significant level. The regressionconfirms two hypotheses: wages per pupil are shown to be correlated with average school sizeand private/public school. According to the results of the regression there seems to be economiesof scale in primary and lower secondary schools, and public schools spend more money on wagesper pupil than private schools.
Figure 4: Correlation between explanatory variables in the regression in figure 3Socioeconomic indexSocioeconomic indexAverage school sizeDummy (1=public, 0=private)1,0000,3800,2651,0000,660Average school size Dummy (1=public, 0=private)
1,000
There is a considerable correlation between average school size and school ownership. On averagethe public schools are bigger than the private schools. On the other hand there is only a weakcorrelation between school ownership and socioeconomic index, and the sign of the correlationshows that the private schools seem to have pupils with weaker social background than the publicschools.
16
Even though public and private schools compete to attract pupils they do not compete on equalconditions. Private schools only receive 75 pct. of the cost per pupil in the public schools, and theyhave to cover the rest of their costs by tuition fees.The public schools receive their budget as determined by the municipal council. Normally theallocation of funding will be based on a resource allocation model operating with a standard tarifffor each pupil calculated as the average cost and with supplementary budget allocation tochildren with learning disabilities, social problems etc. The supplementary budget allocation iseventually decided after negotiation where the schools have to explain why the children in theirschool have more severe learning disabilities and social problems. The private schools do not havea similar possibility of getting special grants to pupils with social problems etc.Since private and public schools operate under different conditions, they will be analyzedseparately in the following section.
17
Comparing cost at private and public schoolsWhen analysing wage costs separately in public and in private schools the two hypotheses, H1 andH2 in figure 2, will form our model. The model then represents the conditions that, from aproduction-perspective, should decide the cost in both private and public schools when we look atthem separately.The results from the regression on data from the private schools are shown in figure 5 and 6.Figure 5: Regressions for wage per pupil in private schoolsCoefficientSocio economic indexAverage school size-487,29-24,32t-value-0,40-3,37P>|t|0,6910,001
The model is a simple linear model explaining the wage per pupil by socioeconomic index andaverage school size.The regression rejects the hypothesis that wages per pupil depends upon weak socioeconomicstructures. The regression confirms that there seems to be economies of scale in private primaryand lower secondary schools. There is no severe correlation between the two explanatoryvariables.Figure 6: Correlation between explanatory variables in the regression in figure 5Socioeconomic indexSocioeconomic index1,000Average school size0,2361,000Average school size
The results from the regression on data from the public schools are shown in figure 7 and 8.Figure 7: Regressions for wage per pupil in public schoolsCoefficientSocioeconomic indexAverage school size-4429,41-2,59t-value-3,95-0,67P>|t|0,0000,504
The model is also a simple linear model explaining the wage per pupil by socioeconomic index andaverage school size. The regression rejects the hypothesis that wages per pupil depend uponaverage school size. The regression confirms that the public schools where the pupils have a weak
18
social background have higher cost. There is no correlation between the two explanatoryvariables.Figure 8: Correlation between explanatory variables in the regression in figure 7Socioeconomic indexSocioeconomic indexAverage school size1,0000,0961,000Average school size
The private schools lower cost by exploiting economies of scale, which does not seem to be thecase for the public schools. An explanation could be that the private schools on average aresmaller than the public schools, so that some public schools could be beyond the part of the costfunction with economies of scale. It is however not possible to verify this explanation. As there isan overlap in school sizes between public and private schools it is however possible to conclude,that even with some public schools on the part of the cost function without economies of scale,the public schools do not generally behave like firms in a competitive market (minimizing costs),because they do not (at least all of them) adjust the school size to the level with the lowestaverage cost.
Public schools having pupils with weak social backgrounds have higher cost, as expected, since themunicipalities generally give additional grants to these schools. The same pattern is not found forthe private schools. As the children in private schools are found in figure 3 and 4 not havingsignificantly stronger social backgrounds than children in public schools, that is probably not theexplanation. The private schools can scarcely get higher grants if they have a lot of children withweak social backgrounds, and it is probably impossible to make the parents pay a higher tuitionfee, because some of the children have a weak social background. On the other hand someparents might even make their children leave the school, and the school can be forced to closedown if it becomes a well know fact, that a lot of the pupils in the school have severe socialproblems.
19
Comparing economic performance among private and public schoolsThe regressions in chapters 3 and 4 with the narrow production and technologically orientatedexplanatory variables only explain a small part of the variation in wage per pupil. We only get an R-square-value around 0.14. In a production theoretical view the residuals from the regressions inchapters 3 and 4 could be seen as a measure of efficiency. Therefore it could be interesting to testwhether the variation from the predicted value (the residual) is determined by other factors. Wehave two basic hypotheses operationalized by seven variables about what these factors could be.
Figure 9. Explaining the spending on wages in Danish primary and lower secondary schools in2007: Three hypothesesHypotheses and variablesExplained variable: Excess spending on wages(deviation from the predicted value)Variable explanationResiduals from the regressions. A positive figureindicates excess spending on wages.
Hypothesis 1: Income and substitutesH:1.1: Tax base per inhabitantH:1.2: Local income tax levelH:1.3: Service level
Key figures from the Ministry of Interior.Local income tax rate (Ministry of Interior).Relation between total costs in budget 2007 for allmunicipal services and the total needs as measured bythe Ministry of Interior as basis for allocation of blockgrants.
Hypothesis 2: PreferencesH:2.1: Political party of the mayorH:2.2: Fragmentation in the municipal board
Dummy for belonging to the liberal or conservative partyHerfindahl index (calculated with data from the Ministryof Interior)Proportion of over 18-years age being public servants(data from the Danish Statistical Office)Proportion of over 18-years age having a college degree(data from the Danish Statistical Office)
H:2.3: Share of the voters employed in the public sector
H: 2.4 Share of inhabitants with a college degree
20
Income and substitutes: H:1.1, H:1.2 and H:1.3H:1.1The hypothesis states that a large tax base (high income) in the local area implies a higherwillingness to pay for the education of children.H:1.2The hypothesis states that a high tax level will reduce the household’s disposable incomeand thereby make it harder for the private schools to get the parents to pay a higher price forsending their children to a private school.H: 1.3:The hypothesis states that a high general level of public services (including the schools) willmake the competition harder for the private schools, and they will have to lower their price.Preferences: H:2.1, H:2.2, H:2.3 and H:2.4H:2.1The hypothesis states that the voters in right-wing municipalities might have a strongerpreference for private schools.H:2.2The hypothesis states that a fragmented municipality indicates a non-homogenous group ofvoters (parents) that might choose a private school that gives a better fit for their preferencesaccording to the education of their children (ideology, pedagogical principles etc.)H:2.3The hypothesis states that public employees might have a strong preference against privateschools because they generally are against privatization. This hypothesis refers to the idea of awelfare coalition blocking for efficiency in the welfare sector as formulated in Christoffersen andPaldam (2003).H:2.4The hypothesis states that people with higher education might choose private schoolsbecause they might have a higher willingness to pay for the education of their children.The model is a simple linear model explaining the degree of variation from the expected wages perpupil in private schools by all variables from figure 9. First, all variables are included in theestimates in the first column. Then the stepwise Hendry Mizon procedure of deletion of the mostinsignificant variables is pursued until only significant variables remain in the estimates in thesecond column.
21
Figure 10: Regression for the residual (deviation from the expected) from the analysis infigure 5 (private schools)CoefficientFragmentation in themunicipal boardShare of inhabitants with acollege degreeLocal income tax levelTax base per inhabitantPolitical party of the mayorShare of the voters employedin the public sectorService level-3.602,4215.090,14-685,01-0,01-2.294,46-37.775,3726.914,92Full modelt-value-0,281,03-0,70-0,16-1,53-2,571,30P>|t|0,780,310,490,880,130,010,20Reduced modelCoefficientt-value-18.917,97----31.059,26--2,39----2,27-----0,03P>|t|-0,02
The regression confirms the hypothesis that private schools have higher cost (charge a higherprize) in municipalities with a bigger share of inhabitants with a college degree. The regressionhowever first of all confirms the hypothesis that private schools must lower their cost (charge alower price) in municipalities with a bigger share of inhabitants employed in the public sector. Thecorrelation between the explanatory variables in figure 10 and 13 is shown in figure 12. There areno severe correlation problems for the variables in the reduced models.
22
Figure 12: Correlation between explanatory variable in the regressions infigure 11 and 13Share of inhabitantswith a college degreeFragmentation in themunicipal boardPolitical party of themayorShare of the votersemployed in thepublic sector1,0000,062Local income taxlevel
Tax base perinhabitant
Fragmentation inthe municipal boardShare of inhabitantswith a collegedegreeLocal income taxlevelTax base perinhabitantPolitical party of themayorShare of the votersemployed in thepublic sectorService level
1,000
-0,168
1,000
-0,038-0,106-0,006
-0,4830,8100,028
1,000-0,548-0,0991,0000,1491,000
-0,046
0,129
-0,273
0,142
-0,161
-0,106
0,310
0,044
0,393
-0,027
1,000
We also run the regression with the data (residuals) from the public schools. It shows that the onlyvariable that can explain the variation from the expected cost per pupil in public schools is thegeneral service level in the municipality. The service level in the municipality depends on the taxbase, but the block grants in Denmark are used to redistribute the taxes between the rich andpoor municipalities. Furthermore the last 9 years the Danish liberal-conservative government hasenforced a tax-freeze on the municipalities, which makes it very difficult for the municipalities toraise their taxes. On the other hand the municipalities avoid tax-cuts because they are afraid thatit will not be possible to raise the taxes again if necessary. In practice this means, that themunicipal taxes are stuck on the level of taxes they had 9 years ago, and the municipalities just useall the money that they can get their hands on and they all argue that they need more money,because it can only be taken for other municipalities or the central government as shown inChristoffersen and Larsen (2010b).. The public schools with higher wages per pupil than expectedare the schools in municipalities characterized by relatively high taxes or by a strong economy
23
Service level
based on a relatively large tax basis compared to the local needs as expressed by demographic andsocioeconomic structures.
Figure 12: Regression for the residual (deviation from the expected) from the analysis infigure 7 (public schools)CoefficientFragmentation in themunicipal boardShare of inhabitants with acollege degreeLocal income tax levelTax base per inhabitantPolitical party of the mayorShare of the voters employedin the public sectorService level7.448,755.826,56130,87-0,04846,717.145,9836.857,00Full modelt-value0,870,600,20-1,140,910,793,36P>|t|0,3870,5490,8450,2560,3640,4310,001Reduced modelCoefficientt-value------31.088,21------3,34P>|t|------0,001
24
Concluding remarksIn Denmark public and private primary and lower secondary schools compete to attract pupils.The private schools receive less money per pupil from the central government than the publicschools. The parents have to pay a tuition fee, but they do not receive a corresponding deductionin their tax payment. The private schools can be forced to close down if they do not get enoughpupils; this is an unrealistic scenario for a public school.The public schools have a clear economic advantage in the competition with the private schools.Thus for surviving the private schools have to be more efficient than the public schools, and weshow that this is the case since the private schools deliver a higher quality in education and havelower costs. This result appears at the same time as is found, that it cannot be confirmed thatpupils in private schools generally have a stronger social background than pupils in public schools.The private schools in Denmark do not operate under perfect competition: They are run byaltruistic foundations, which do not behave like profit-maximizing firms, the main part of their costare covered by the government, they do not operate under a perfect competitive pricemechanism etc. The main competitive element that the private schools experience is thepossibility of exit from the market, which apparently makes them a lot more efficient than publicschools. This indicates that it may be possible to benefit from introducing a single competitiveelement, when trying to create a semi-market for a semi-public good.
25
ReferencesBrowning M. and Heinesen E. (2007). “Class Size, Teacher Hours and Educational Attainment”.TheScandinavian Journal of Economics,vol. 109Christiansen, Peter Munk (1998):A Prescription Rejected: Market Solutions to Problems ofPublic Sector Governance.Governance, vol. 11Christensen. Gert Laier (2009):Sammenhæng mellem kommuners udgifter til skoledrift ogkommunernes undervisningsresultater.(Connection between expenditure and results in theDanish public schools). CEPOS working-paper nr. 2Christoffersen, Henrik og Karsten Bo Larsen (2009a):Udgiftsbehov og udgifter i kommunerne.(Needs and expenditure level in Danish municipalities). CEPOS working-paper nr. 1.Christoffersen, Henrik og Karsten Bo Larsen (2010a):Den fysiske tilstand af folkeskolers ogprivatskoler bygninger.(Maintenance of buildings – comparison of private and public schools).CEPOS working-paper nr. 7.Christoffersen, Henrik og Karsten Bo Larsen (2010b): Kommuneri nød.(Municipalities in the hourof need). CEPOS working-paper.Christoffersen, Henrik and Martin Paldam (2003): Markets and municipalities: A study of thebehavior of the Danish municipalities.Public Choice,volume 114, nos. 1-2.Finansministeriet (Ministry of Finance) (2003):Frit valg og kvalitet – afregningsmodeller på dekommunale serviceområder(Vouchers – calculation of the right value).Heinesen E. and Graversen B. K. (2005). “TheEffect of School Ressources on EducationalAttainment: evidence from Denmark”.Bulletin of economic research, vol. 57Nannestad, P. (2003).’It’s not the Economy stupid!, Municipal School Expenditures and SchoolAchivement Levels in Denmark”.EPCS Annual Meeting, 25-28 April 2003, AarhusRangvid B.S. (2003).“Do Schools Matter”,PhD. Theses no. 9 -2003, Aarhus School of Business –University of Aarhus.
26
Appendix – variables reflecting pupils socioeconomic background used in the regressionanalysis thatmeasure school-performanceMarksDanish - oral *Male - danish - neatnessMale - danish - spellingMale - danish - writtenMale - maths - oralMale - maths - writtenFemale - danish - neatnessFemale - danish - spellingFemale - danish - writtenFemale - maths - oralFemale - maths - writtenExplanatory variablesGenderFemale *MaleFather IdentifiedFather observedFather not observedMother IdentifiedMother observedMother not observedEquivalent disposable income decileDecile 1Decile 2Decile 3Decile 4Decile 5Decile 6Decile 7Decile 8Decile 9Decile 10 (highest)Age at test time14 years 9 monthsor less14 years 10 months14 years 11 months15 years 0 months15 years 1 month27
15 years 2 months15 years 3 months15 years 4 months15 years 5 months15 years 6 months15 years 7 months15 years 8 months15 years 9 months15 years 10 months15 years 11 months16 years 0 months, or moreNumber of brothers in the household123 or moreNumber of sisters in the household0123 or moreTest-taker lives withMother+ fatherMother re-marriedLone motherFather re-marriedLone fatherOther arrangementsMother place of birthDenmark *The westRest-of-worldFather place of birthDenmark *The westRest-of-worldMother age when child bornTeenage20-2425-2930-3435-3940 plusFather age when child bornTeenage28
20-2425-2930-3435-3940 plusMother labour market statusSelf-employedWage earnerUnemployedEducationActivation programWelfareOther out-of-labour-forceFather labour market statusSelf-employedWage earnerUnemployedEducationActivation programWelfareOther out-of-labour-forceMother educationMissing education informationGrundskoleErhvervsfagligGymnasium or KVU *Short tertiaryLong tertiaryFather educationMissing education informationGrundskoleErhvervsfagligGymnasium or KVU *Short tertiaryLong tertiary
29
Figure A1: Wage pr. pupil in private schools arranged in ascending order80000700006000050000400003000020000100000Note: The blue line indicates the mean
Figure A2: Wage pr. pupil in public schools arranged in ascending order700006000050000400003000020000100000Note: The blue line indicates the mean
30
Tidligere udgivne CEPOS arbejdspapirer:
Udgiftsbehov og udgifter i kommunerne - Henrik Christoffersen ogKarsten Bo Larsen, maj 2009.Sammenhængen mellem kommuners udgifter til skoledrift og skolensundervisningsresultater – Geert Laier Christensen, august 2009.Omkostningsniveauet i offentlig og privat produktion af sundhedsydelser– Henrik Christoffersen og Karsten Bo Larsen, september 2009.Multikulturalisme og integration – Søren Hviid Pedersen, september2009.Perceived municipal cuts and the welfare coalition – HenrikChristoffersen, oktober 2009.Budgetdisciplin i kommunerne – Henrik Christoffersen og Karsten BoLarsen, november 2009.Den fysiske tilstand af folkeskoler og privatskolers bygninger – HenrikChristoffersen og Karsten Bo Larsen, januar 2010Kommunale skatteforhøjelser – Henrik Christoffersen og Karsten BoLarsen, marts 2010.De økonomiske betingelser for kommunalt selvstyre i Danmark
Arbejdspapirerne kan findes på www.cepos.dk
31
Center for Politiske Studier
CEPOS er en uafhængig tænketank, der fremmer et Danmark baseret på
frihed, ansvar, privat initiativ og en begrænset statsmagt.
CEPOS er stiftet af fremtrædende danske erhvervsfolk, tænkere ogkulturpersonligheder og indledte sit arbejde den 10. marts 2005.CEPOS ønsker at bidrage til mere personlig og økonomisk frihed,retsstat og demokrati samt sunde borgerlige institutionersom familie, foreninger og kulturliv.CEPOS vil omlægge og begrænse direkte og indirekte støtte fra detoffentlige til befolkningen. Støtten skal komme de svage til gavn ogafskaffes for personer, der kan klare sig selv.CEPOS går ind for fri konkurrence og frie markeder, og er tilhænger afglobal frihandel og imod statsstøtte til erhvervslivet.CEPOS udfører ikke opgaver på begæring af noget politisk parti, nogenmyndighed, erhvervsvirksomhed, organisation eller privatperson32
CEPOS forlaget - Landgreven 3, 3. sal - 1301 København K – www.cepos.dk
33